File:Land use CO2 emissions grid digraph inputvariable dot.png
Jump to navigation
Jump to search

No higher resolution available.
Land_use_CO2_emissions_grid_digraph_inputvariable_dot.png (384 × 181 pixels, file size: 11 KB, MIME type: image/png)
ImageMap
When including this image in a wiki page, use the following mark-up to enable links:
<imagemap>
File:Land_use_CO2_emissions___grid_digraph_inputvariable_dot.png
rect 101 5 323 56 [[Land-use CO2 emissions - grid]]
rect 5 125 221 176 [[Atmospheric composition and climate]]
rect 245 127 376 175 [[Climate policy]]</imagemap>
See ImageMap for more information.
File history
Click on a date/time to view the file as it appeared at that time.
| Date/Time | Thumbnail | Dimensions | User | Comment | |
|---|---|---|---|---|---|
| current | 16:43, 20 March 2020 | | 384 × 181 (11 KB) | Graphviz (talk | contribs) | |
| 15:58, 20 March 2020 | 235 × 61 (3 KB) | Graphviz (talk | contribs) | |||
| 16:49, 19 March 2020 | 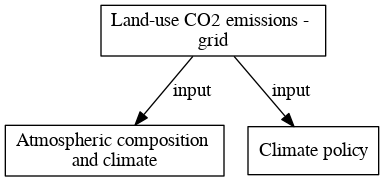 | 384 × 181 (11 KB) | Oostenrijr (talk | contribs) | ||
| 16:49, 19 March 2020 | 235 × 61 (3 KB) | Oostenrijr (talk | contribs) | |||
| 11:23, 19 July 2017 | 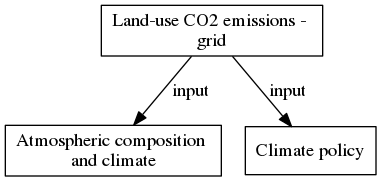 | 381 × 181 (11 KB) | Oostenrijr (talk | contribs) | generated by the GraphViz extension from the Land-use CO2 emissions - grid page |
You cannot overwrite this file.
File usage
There are no pages that use this file.