File:Secondary energy price digraph inputvariable dot.png: Difference between revisions
Jump to navigation
Jump to search
Oostenrijr (talk | contribs) (generated by the GraphViz extension from the Secondary energy price page) |
Oostenrijr (talk | contribs) (generated by the GraphViz extension from the Secondary energy price page) |
||
| (One intermediate revision by the same user not shown) | |||
| Line 4: | Line 4: | ||
<imagemap> | <imagemap> | ||
File:Secondary_energy_price_digraph_inputvariable_dot.png | File:Secondary_energy_price_digraph_inputvariable_dot.png | ||
rect 5 5 197 53 [[Secondary energy price]]</imagemap> | rect 5 5 197 53 [[Secondary energy price]] | ||
rect 33 123 169 171 [[Energy demand]]</imagemap> | |||
</nowiki> | </nowiki> | ||
See [https://www.mediawiki.org/wiki/Extension:ImageMap ImageMap] for more information.[[Category:GraphViz]][[Category:GraphViz dot]] | See [https://www.mediawiki.org/wiki/Extension:ImageMap ImageMap] for more information.[[Category:GraphViz]][[Category:GraphViz dot]] | ||
Latest revision as of 12:32, 25 July 2017
ImageMap
When including this image in a wiki page, use the following mark-up to enable links:
<imagemap>
File:Secondary_energy_price_digraph_inputvariable_dot.png
rect 5 5 197 53 [[Secondary energy price]]
rect 33 123 169 171 [[Energy demand]]</imagemap>
See ImageMap for more information.
File history
Click on a date/time to view the file as it appeared at that time.
| Date/Time | Thumbnail | Dimensions | User | Comment | |
|---|---|---|---|---|---|
| current | 16:42, 20 March 2020 | 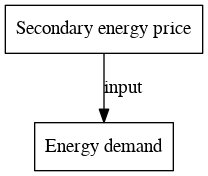 | 208 × 176 (6 KB) | Graphviz (talk | contribs) | |
| 16:02, 20 March 2020 | 208 × 59 (3 KB) | Graphviz (talk | contribs) | |||
| 12:32, 25 July 2017 | 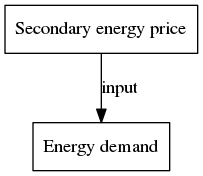 | 203 × 176 (6 KB) | Oostenrijr (talk | contribs) | generated by the GraphViz extension from the Secondary energy price page | |
| 12:30, 25 July 2017 | 203 × 59 (3 KB) | Oostenrijr (talk | contribs) | generated by the GraphViz extension from the Secondary energy price page |
You cannot overwrite this file.
File usage
There are no pages that use this file.