Flood risks/Policy issues: Difference between revisions
Jump to navigation
Jump to search
Oostenrijr (talk | contribs) No edit summary |
Oostenrijr (talk | contribs) No edit summary |
||
| Line 2: | Line 2: | ||
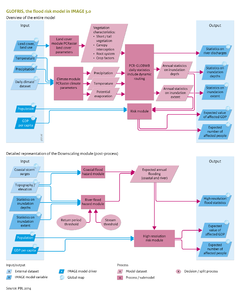
|Description=GLOFRIS can be used to assess a wide range of scenarios based on data on land cover and climate change. The module , for instance, has been used to analyse the impact of floods on Bangladesh published in [[Winsemius et al., 2012]]. Calculations showed that population and economic growth are more likely to have greater impact on future flood risks than the impacts of climate change. Thus, the focus would need to be on how the changes in socio-economic conditions can be combined with flood risk reduction. | |Description=GLOFRIS can be used to assess a wide range of scenarios based on data on land cover and climate change. The module , for instance, has been used to analyse the impact of floods on Bangladesh published in [[Winsemius et al., 2012]]. Calculations showed that population and economic growth are more likely to have greater impact on future flood risks than the impacts of climate change. Thus, the focus would need to be on how the changes in socio-economic conditions can be combined with flood risk reduction. | ||
The study compares the current situation with the impacts of changes in climate and socio-economic conditions. The left panel in | The study compares the current situation with the impacts of changes in climate and socio-economic conditions. The left panel in the figure below shows the pattern of a flood occurring once every 30 years according to GLOFRIS, scaled down to 1x1 km2 over Bangladesh, under current climate conditions. The right-hand panels in the figure below show the resulting expected values of damage under current climate and socio-economic conditions, based on the two methods described in [[Winsemius et al., 2012]]. Flood risks have been computed using the two methods for the reference situation and for two climate data sets. | ||
|Example=To date, the model has not been used extensively for specific policy interventions. Measures taken elsewhere in the IMAGE framework to prevent climate change could also reduce flood risks. | |Example=To date, the model has not been used extensively for specific policy interventions. Measures taken elsewhere in the IMAGE framework to prevent climate change could also reduce flood risks. | ||
}} | }} | ||
Revision as of 09:14, 24 June 2014
Parts of Flood risks/Policy issues
| Component is implemented in: |
|
| Related IMAGE components |
| Models/Databases |
| Key publications |