Flowchart Land degradation: Difference between revisions
Jump to navigation
Jump to search
m (moved Flowchart SD to Flowchart LD) |
Oostenrijr (talk | contribs) No edit summary |
||
| (3 intermediate revisions by 2 users not shown) | |||
| Line 1: | Line 1: | ||
{{FigureTemplate | {{FigureTemplate | ||
|Figure= | |Figure=110x img13.png | ||
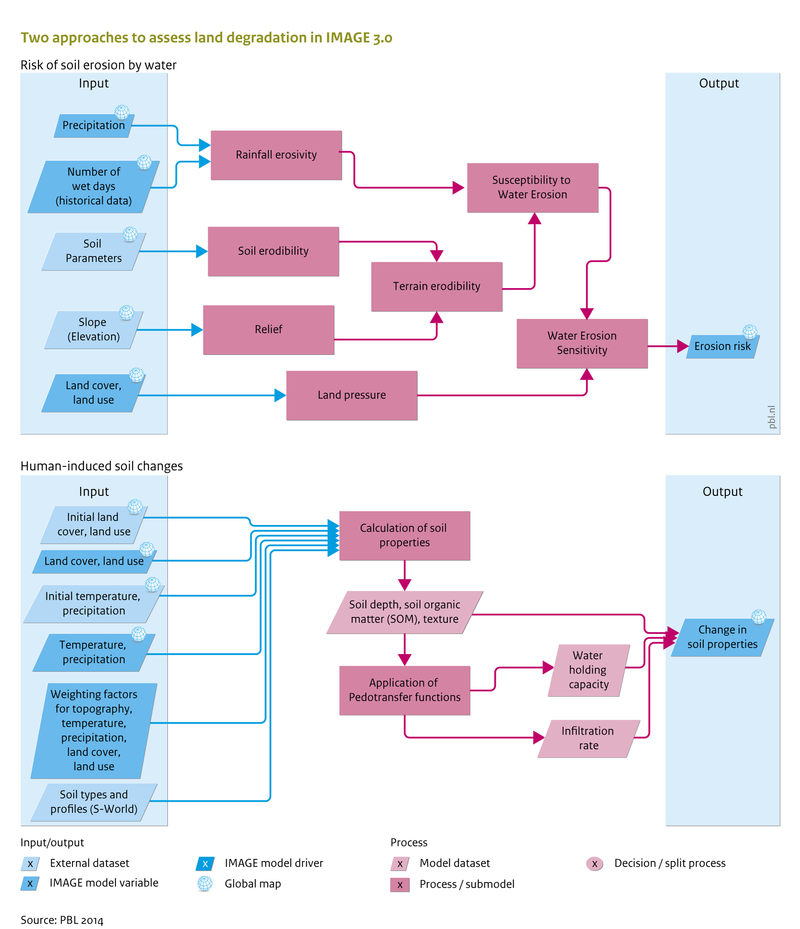
|AltText= | |AltText=Two approaches to assess land degradation in IMAGE 3.0 | ||
|Caption={{PAGENAME}}. See also the Input/Output Table on the introduction page. | |||
|FigureType=Flowchart | |FigureType=Flowchart | ||
|OptimalSize=800 | |OptimalSize=800 | ||
|Component=Land degradation; | |Component=Land degradation; | ||
}} | }} | ||
Revision as of 17:09, 24 June 2014
Caption: Flowchart Land degradation. See also the Input/Output Table on the introduction page.
Figure is used on page(s): Land degradation