Baseline figure Carbon cycle and natural vegetation: Difference between revisions
Jump to navigation
Jump to search
No edit summary |
Dafnomilii (talk | contribs) No edit summary |
||
| (9 intermediate revisions by 3 users not shown) | |||
| Line 1: | Line 1: | ||
{{FigureTemplate | {{FigureTemplate | ||
|Figure= | |Figure=600px 075g img13.png | ||
| | |Description=Cumulative terrestrial carbon flux of long-term climate scenarios | ||
|AltText=Cumulative terrestrial carbon flux of long-term climate scenarios | |||
|Caption=Cumulative terrestrial carbon flux of long-term climate scenarios (Müller et al., 2016) | |||
|FigureType=Baseline figure | |FigureType=Baseline figure | ||
|OptimalSize= | |OptimalSize=600 | ||
|Component= | |Component=Carbon cycle and natural vegetation;IMAGE framework summary/Earth system | ||
}} | }} | ||
Latest revision as of 18:46, 22 November 2021
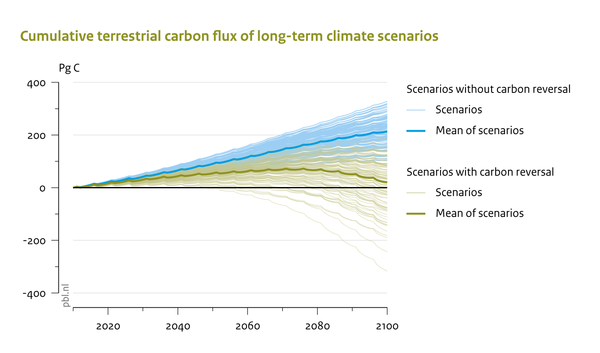
Cumulative terrestrial carbon flux of long-term climate scenarios
Caption: Cumulative terrestrial carbon flux of long-term climate scenarios (Müller et al., 2016)
Figure is used on page(s): Carbon cycle and natural vegetation, IMAGE framework summary/Earth system