Policy intervention figure Land degradation: Difference between revisions
Jump to navigation
Jump to search

No edit summary |
Oostenrijr (talk | contribs) m (Oostenrijr moved page Policy intervention figure LD to Policy intervention figure Land degradation without leaving a redirect: Text replace - "LD" to "Land degradation") |
||
| (One intermediate revision by one other user not shown) | |||
| Line 1: | Line 1: | ||
{{FigureTemplate | {{FigureTemplate | ||
|Figure= | |Figure=111x img13.png | ||
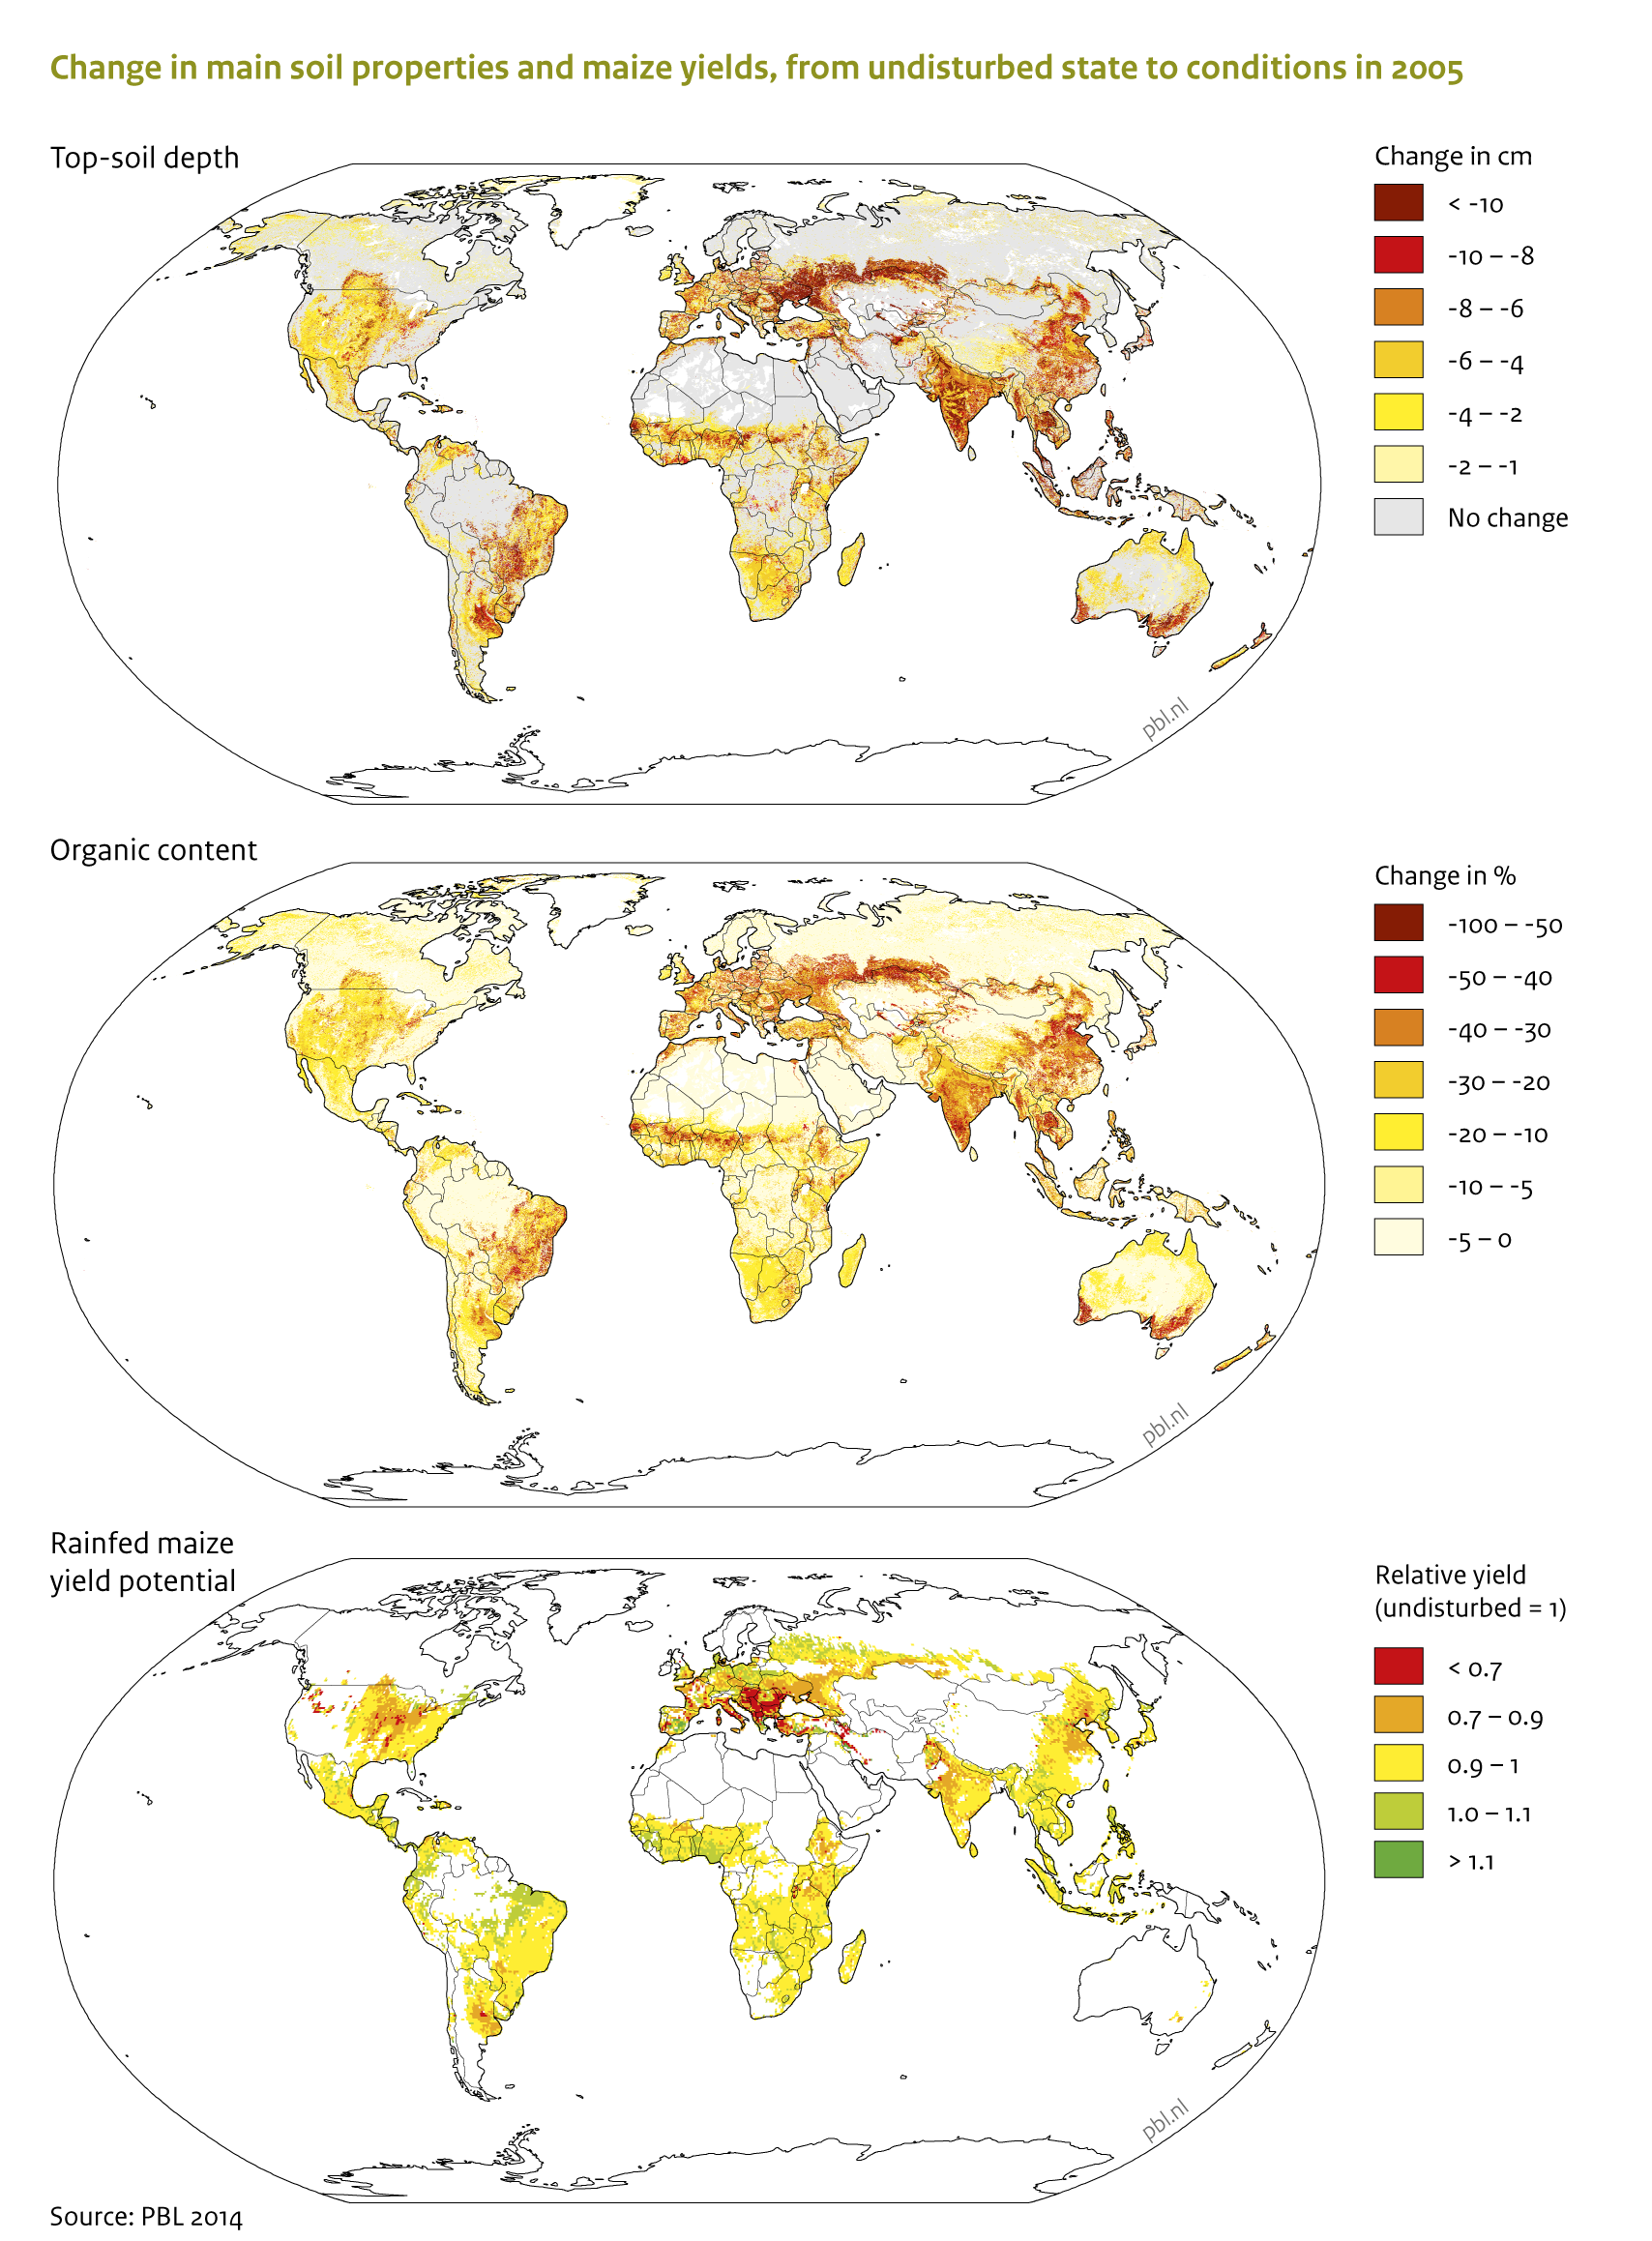
|Caption= | |Caption=As a result of soil degradation and changes in soil properties, yields are up to 30 % lower than they would have been under pristine conditions, in some parts of the world. | ||
|FigureType=Policy intervention figure | |FigureType=Policy intervention figure | ||
|OptimalSize=600 | |OptimalSize=600 | ||
|Component=Land degradation; | |Component=Land degradation; | ||
|AltText=Changein main soil properties and maize yields, from undisturbed state to conditions in 2005 | |||
}} | }} | ||
Latest revision as of 16:27, 24 June 2014
Caption: As a result of soil degradation and changes in soil properties, yields are up to 30 % lower than they would have been under pristine conditions, in some parts of the world.
Figure is used on page(s): Land degradation