Baseline figure Energy demand: Difference between revisions
Jump to navigation
Jump to search

(CSV import) |
Oostenrijr (talk | contribs) m (Oostenrijr moved page Baseline figureEnergy demand to Baseline figure Energy demand without leaving a redirect) |
||
| (2 intermediate revisions by 2 users not shown) | |||
| Line 4: | Line 4: | ||
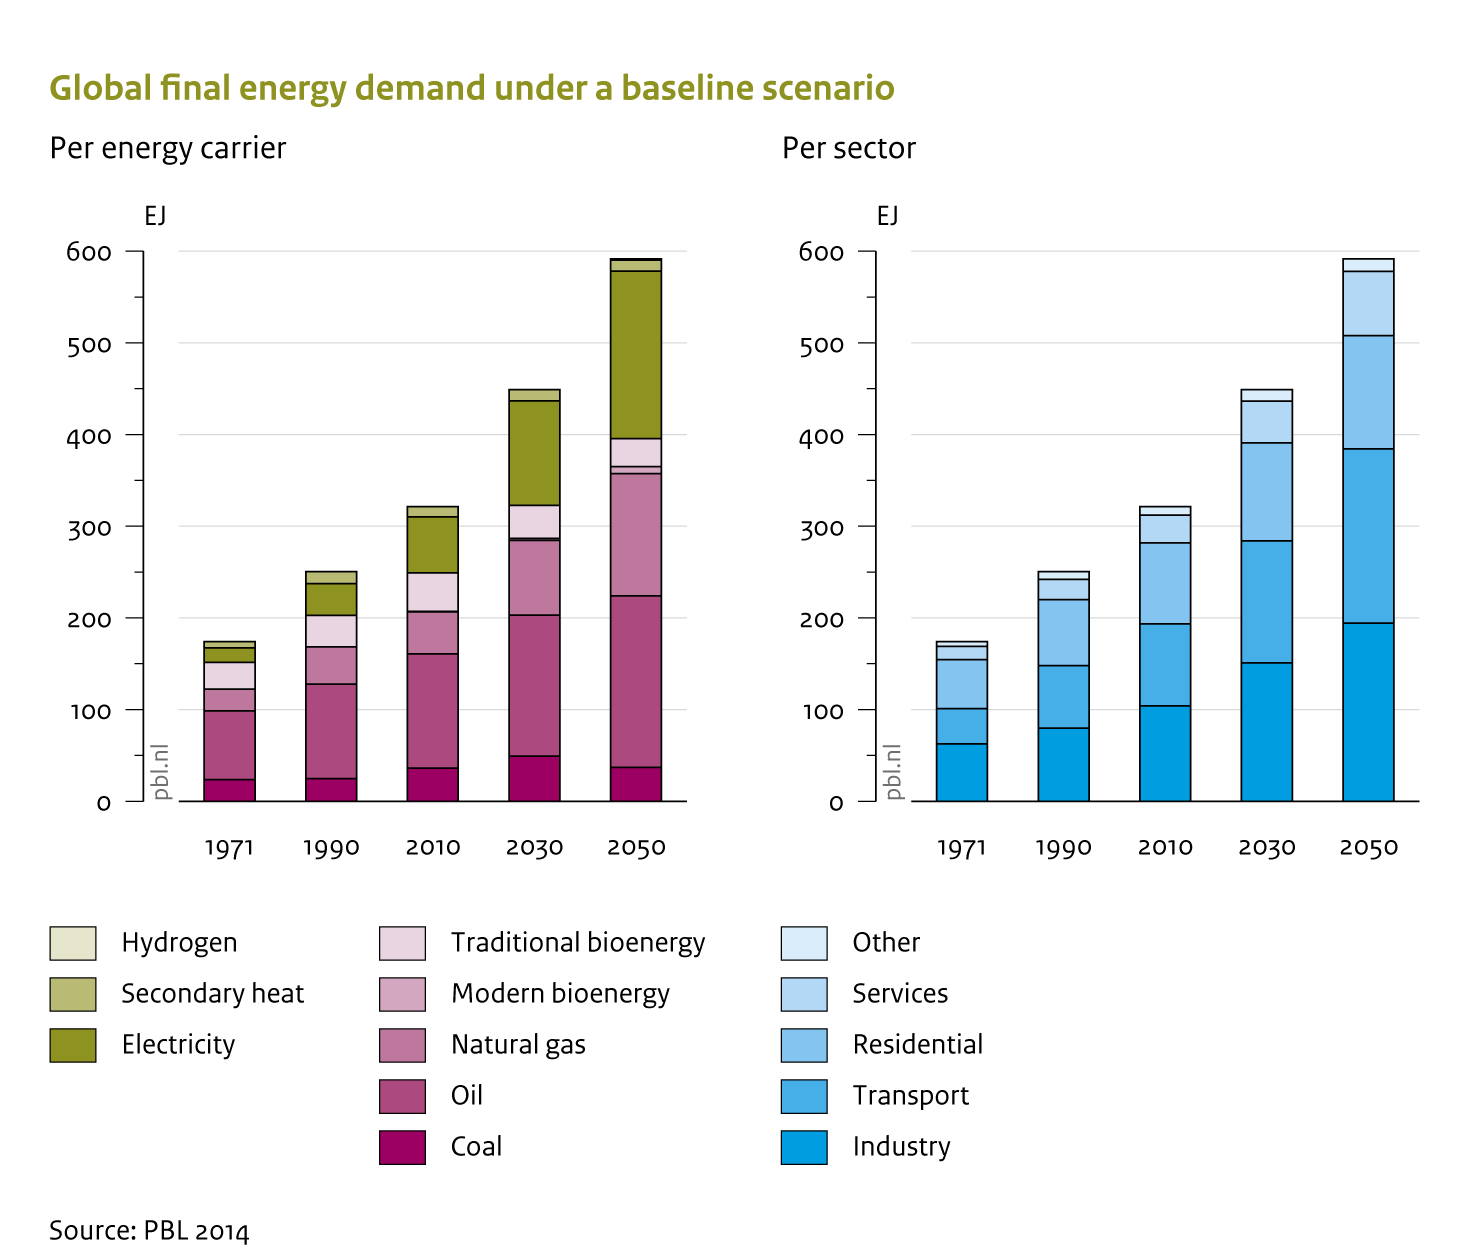
|Caption=Between 2010 and 2050 energy demand for transport and industry, and for natural gas and electricity contribute most to the overall increase. | |Caption=Between 2010 and 2050 energy demand for transport and industry, and for natural gas and electricity contribute most to the overall increase. | ||
|FigureType=Baseline figure | |FigureType=Baseline figure | ||
|OptimalSize= | |OptimalSize=600 | ||
|Component=Energy demand; | |Component=Energy demand; | ||
}} | }} | ||
Latest revision as of 11:59, 30 June 2014
Caption: Between 2010 and 2050 energy demand for transport and industry, and for natural gas and electricity contribute most to the overall increase.
Figure is used on page(s): Energy demand