Policy intervention figure Drivers: Difference between revisions
Jump to navigation
Jump to search
(CSV import) |
Dafnomilii (talk | contribs) mNo edit summary |
||
| (One intermediate revision by one other user not shown) | |||
| Line 2: | Line 2: | ||
|Figure=143x img13.png | |Figure=143x img13.png | ||
|AltText=GDP under OECD baseline and the SSP scenarios | |AltText=GDP under OECD baseline and the SSP scenarios | ||
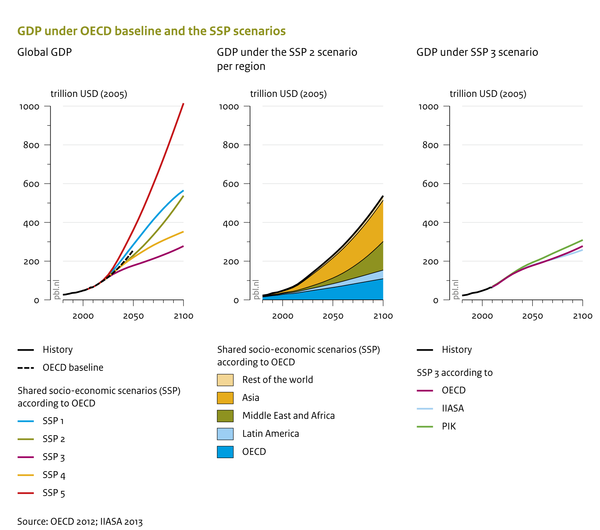
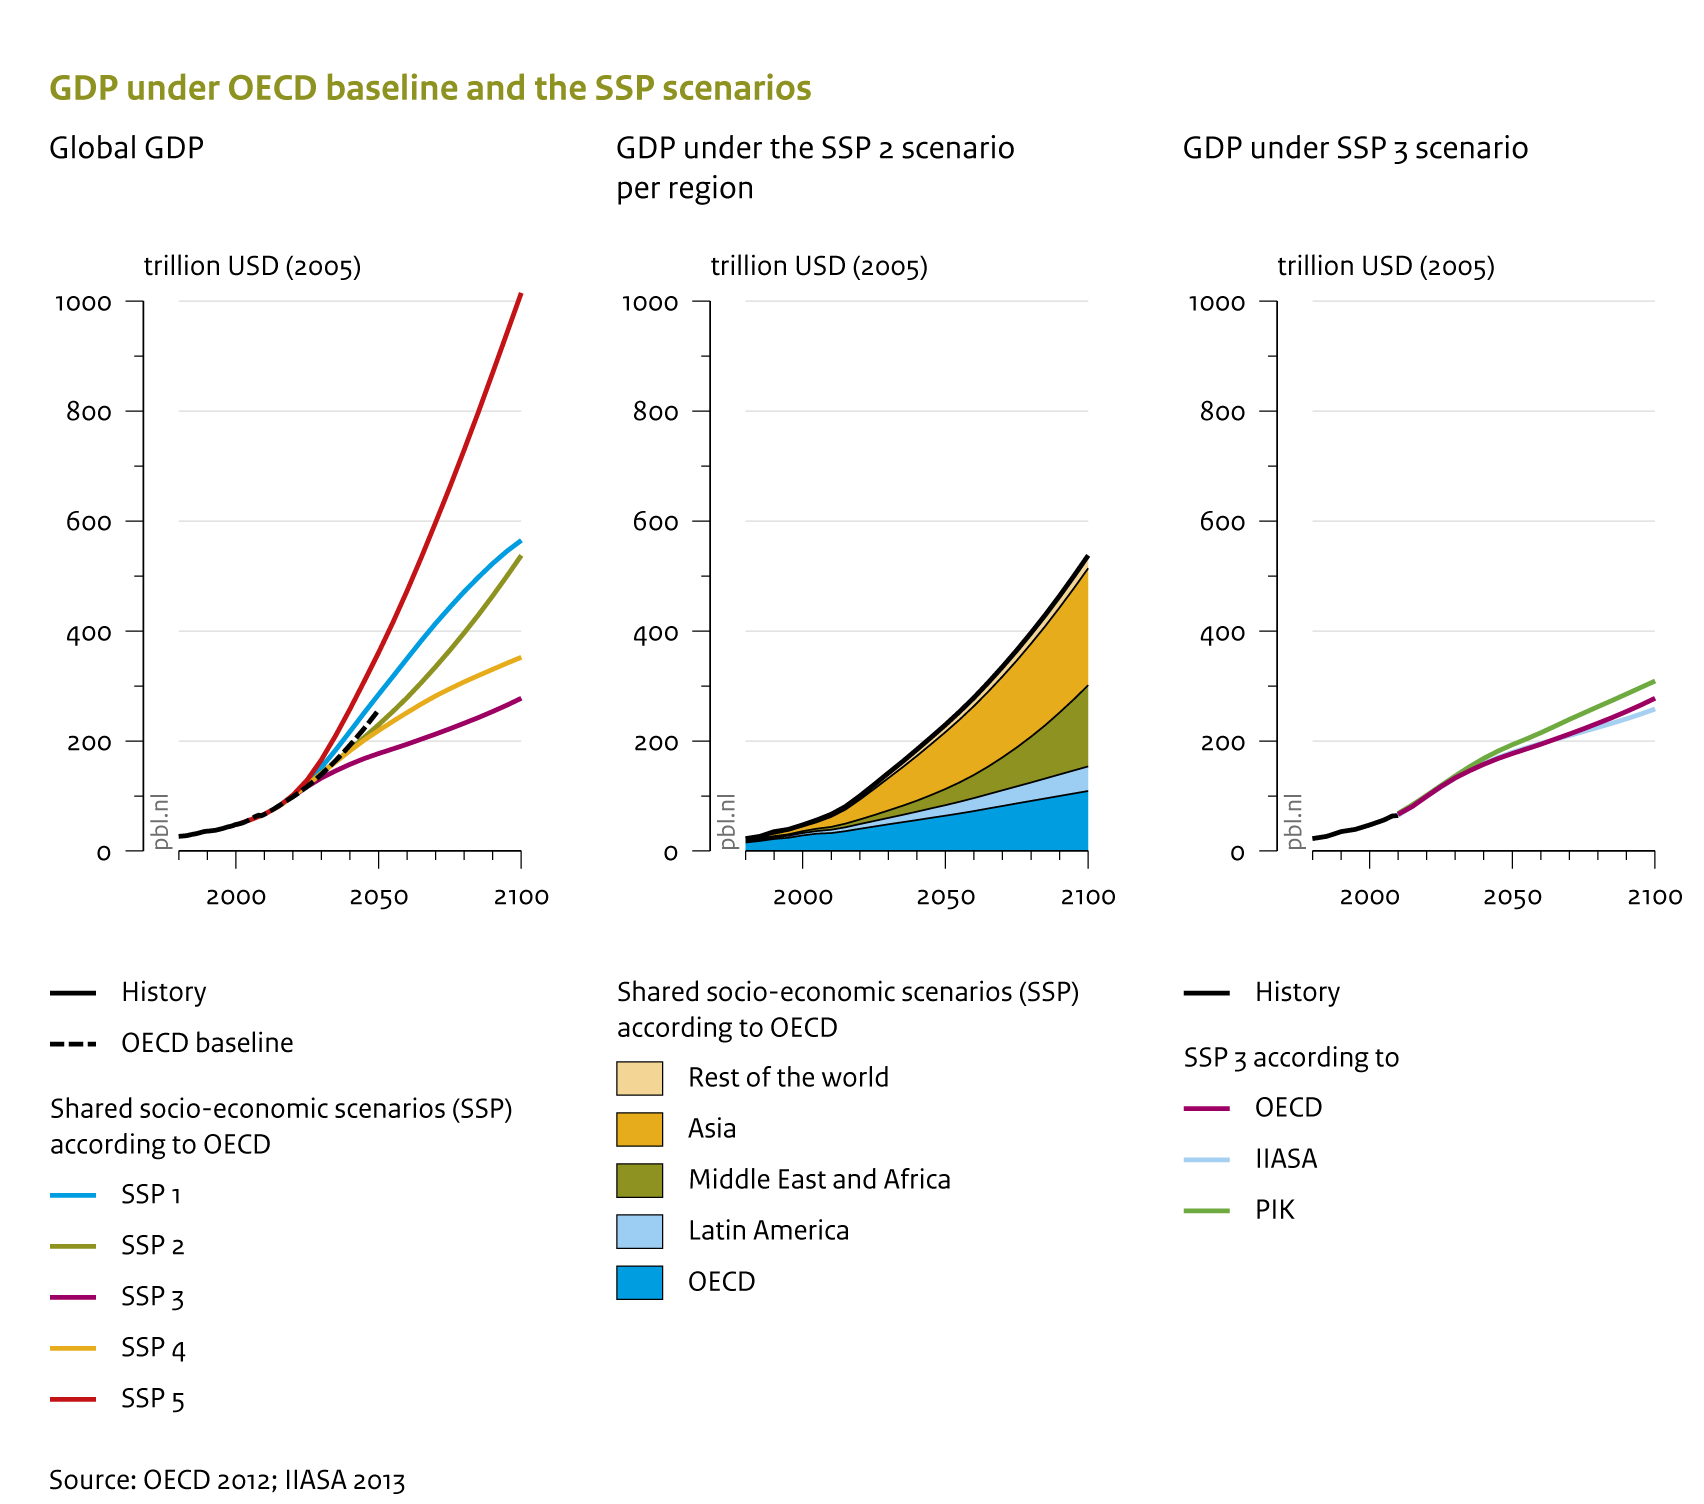
|Caption=Projected total world GDP in the OECD environmental outlook (OECD, 2012) and in the SSP scenarios according to OECD (left), per world region in SSP2 according to OECD (middle) and according to different sources for SSP3 (right). GDP (Gross Domestic Product) is shown in purchasing power parity (ppp), SSP data from SSP database (IIASA, 2013). | |Caption=Projected total world GDP in the OECD environmental outlook (OECD, 2012) and in the SSP scenarios according to OECD (left), per world region in SSP2 according to OECD (middle) and according to different sources for SSP3 (right). GDP (Gross Domestic Product) is shown in purchasing power parity (ppp), SSP data from the SSP database (IIASA, 2013). | ||
|FigureType=Policy intervention figure | |FigureType=Policy intervention figure | ||
|OptimalSize=600 | |OptimalSize=600 | ||
|Component=Drivers; | |Component=Drivers; | ||
}} | }} | ||
Latest revision as of 12:09, 8 October 2021
Caption: Projected total world GDP in the OECD environmental outlook (OECD, 2012) and in the SSP scenarios according to OECD (left), per world region in SSP2 according to OECD (middle) and according to different sources for SSP3 (right). GDP (Gross Domestic Product) is shown in purchasing power parity (ppp), SSP data from the SSP database (IIASA, 2013).
Figure is used on page(s): Drivers