File:GDP per capita grid digraph inputvariable dot.png: Difference between revisions
Jump to navigation
Jump to search
Oostenrijr (talk | contribs) (generated by the GraphViz extension from the GDP per capita - grid page) |
Oostenrijr (talk | contribs) (Oostenrijr uploaded a new version of File:GDP per capita grid digraph inputvariable dot.png) |
Latest revision as of 08:37, 19 November 2018
ImageMap
When including this image in a wiki page, use the following mark-up to enable links:
<imagemap>
File:GDP_per_capita___grid_digraph_inputvariable_dot.png
rect 155 5 333 53 [[GDP per capita - grid]]
rect 5 123 168 171 [[Ecosystem services]]
rect 193 123 295 171 [[Flood risks]]
rect 319 123 408 171 [[Nutrients]]</imagemap>
See ImageMap for more information.
File history
Click on a date/time to view the file as it appeared at that time.
| Date/Time | Thumbnail | Dimensions | User | Comment | |
|---|---|---|---|---|---|
| current | 14:36, 20 March 2020 |  | 423 × 176 (10 KB) | Graphviz (talk | contribs) | |
| 13:53, 20 March 2020 | 197 × 59 (3 KB) | Graphviz (talk | contribs) | |||
| 15:44, 19 March 2020 |  | 423 × 176 (10 KB) | Oostenrijr (talk | contribs) | ||
| 15:44, 19 March 2020 | 197 × 59 (3 KB) | Oostenrijr (talk | contribs) | |||
| 14:17, 12 March 2020 | 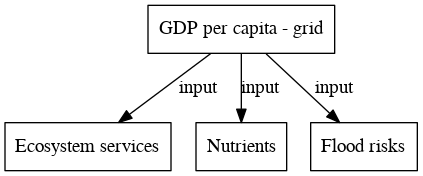 | 423 × 176 (10 KB) | Oostenrijr (talk | contribs) | ||
| 14:16, 12 March 2020 |  | 197 × 179 (7 KB) | Oostenrijr (talk | contribs) | ||
| 08:37, 19 November 2018 | 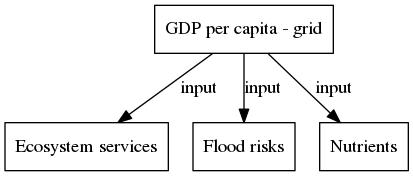 | 413 × 176 (10 KB) | Oostenrijr (talk | contribs) | generated by the GraphViz extension from the GDP per capita - grid page | |
| 10:00, 19 July 2017 |  | 413 × 176 (10 KB) | Oostenrijr (talk | contribs) | generated by the GraphViz extension from the GDP per capita - grid page |
You cannot overwrite this file.
File usage
There are no pages that use this file.