Flowchart Aquatic biodiversity: Difference between revisions
Jump to navigation
Jump to search
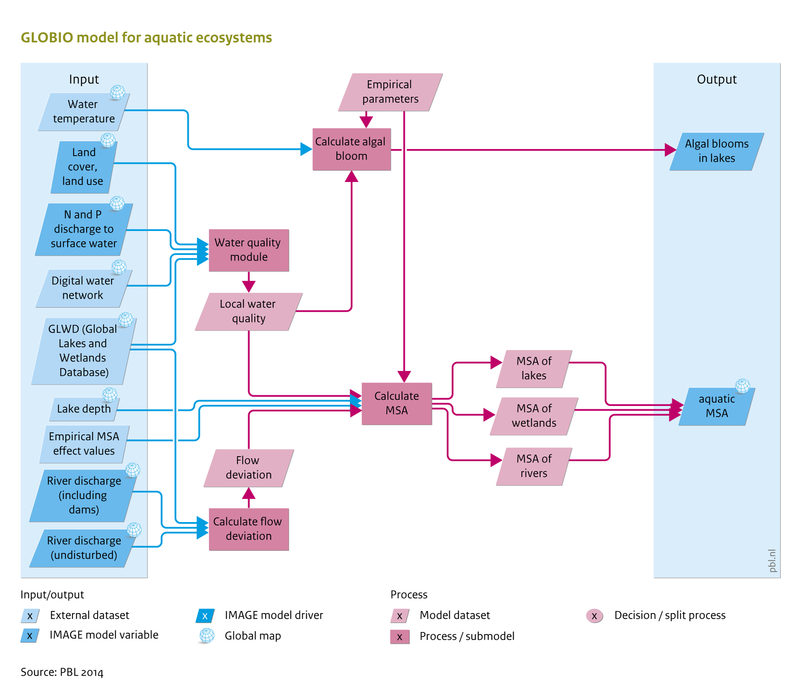
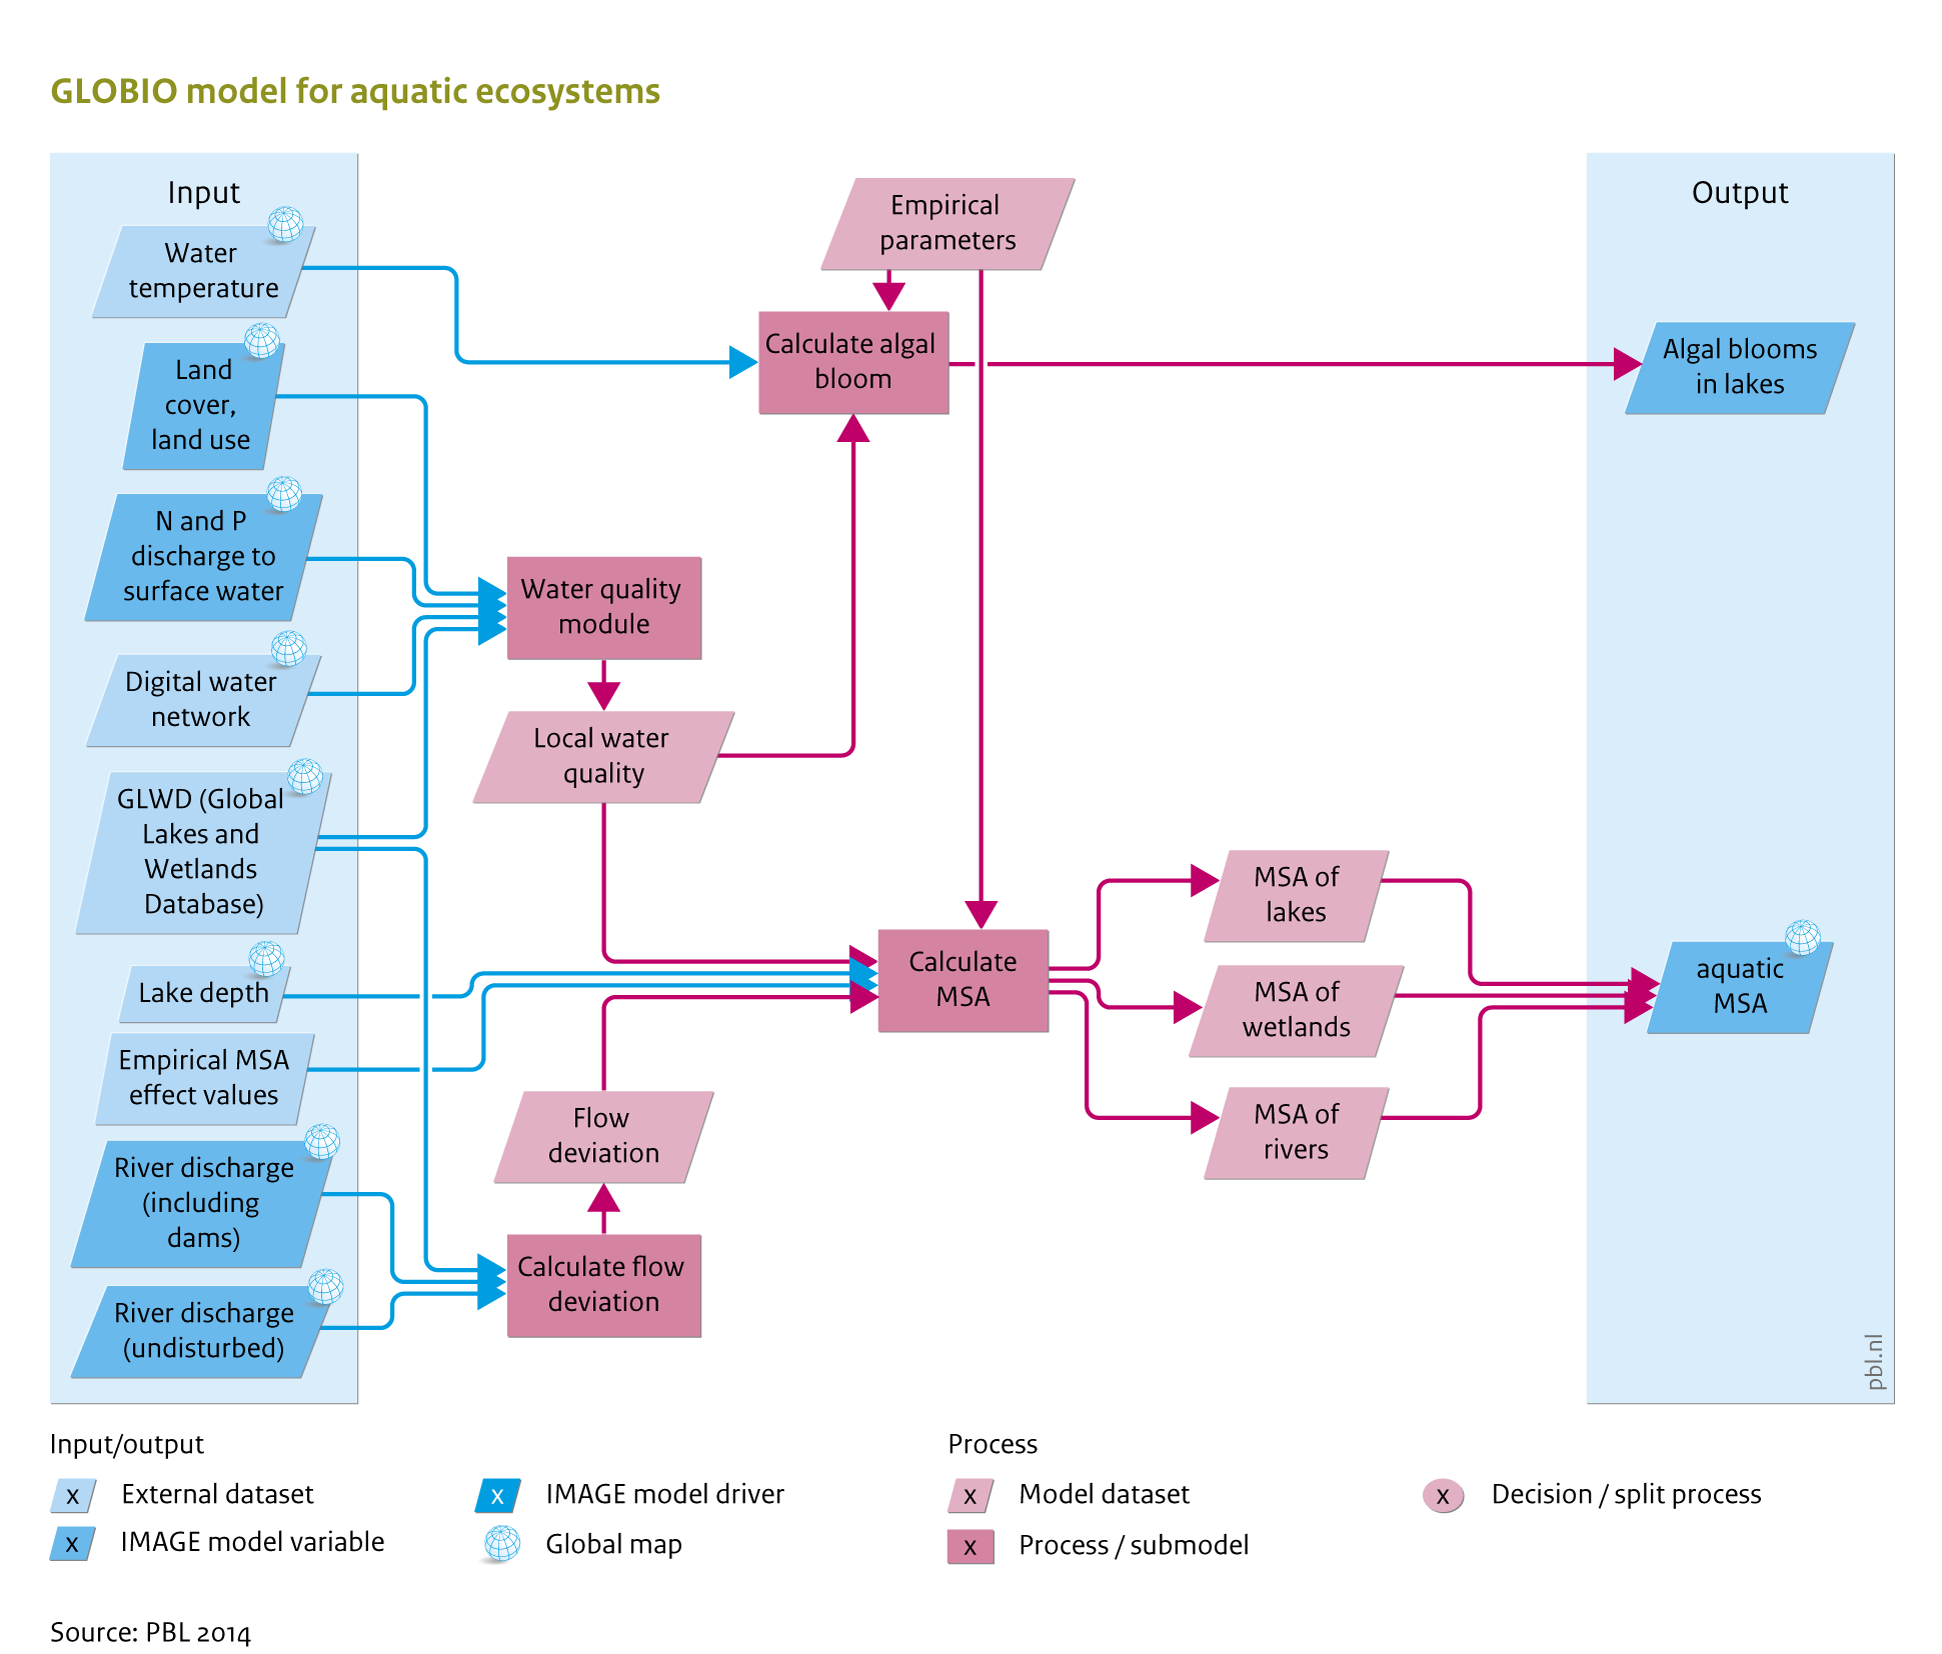
(Created page with "{{FigurePageTemplate |Figure=101s_img13 |Caption=Schematic representation of GLOBIO model for aquatic ecosystems |Component=Aquatic biodiversity; }}") |
Oostenrijr (talk | contribs) No edit summary |
||
| (9 intermediate revisions by 3 users not shown) | |||
| Line 1: | Line 1: | ||
{{ | {{FigureTemplate | ||
|Figure= | |Figure=101s img13.png | ||
| | |AltText=GLOBIO model for aquatic ecosystems | ||
|Component=Aquatic biodiversity; | |Caption={{PAGENAME}}. See also the Input/Output Table on the introduction page. | ||
|FigureType=Flowchart | |||
|OptimalSize=800 | |||
|Component=Aquatic biodiversity; | |||
}} | }} | ||
Latest revision as of 17:03, 24 June 2014
Caption: Flowchart Aquatic biodiversity. See also the Input/Output Table on the introduction page.
Figure is used on page(s): Aquatic biodiversity