Baseline figure Water: Difference between revisions
Jump to navigation
Jump to search
(Created page with "{{FigurePageTemplate |Figure=082x_img13.png |Caption=a (top): global water demand (left) and people living under water stress (right), according to the OECD baseline (OECD 201...") |
Oostenrijr (talk | contribs) m (Oostenrijr moved page Baseline figure H to Baseline figure Water without leaving a redirect: Text replace - "H" to "Water") |
||
| (6 intermediate revisions by 2 users not shown) | |||
| Line 1: | Line 1: | ||
{{ | {{FigureTemplate | ||
|Figure= | |Figure=082x img13.png | ||
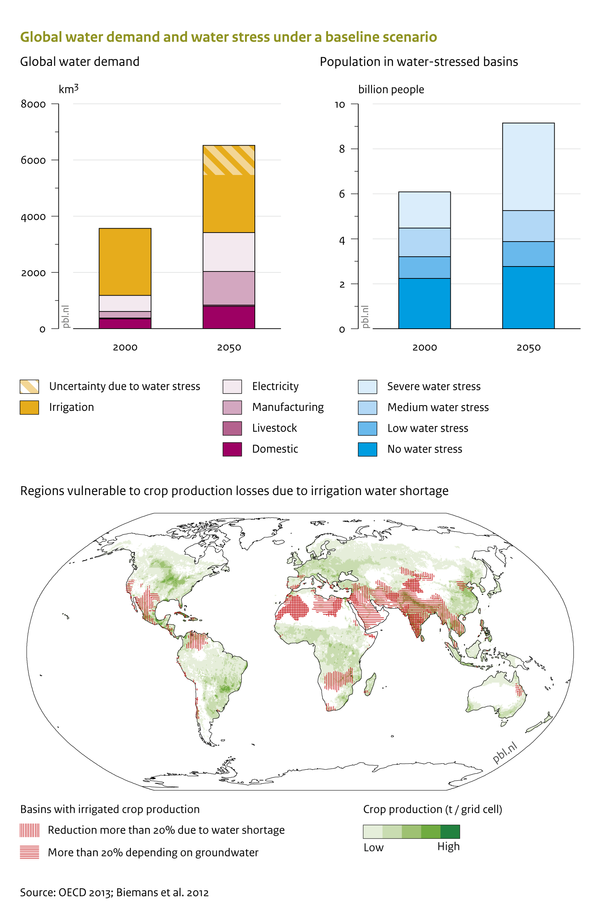
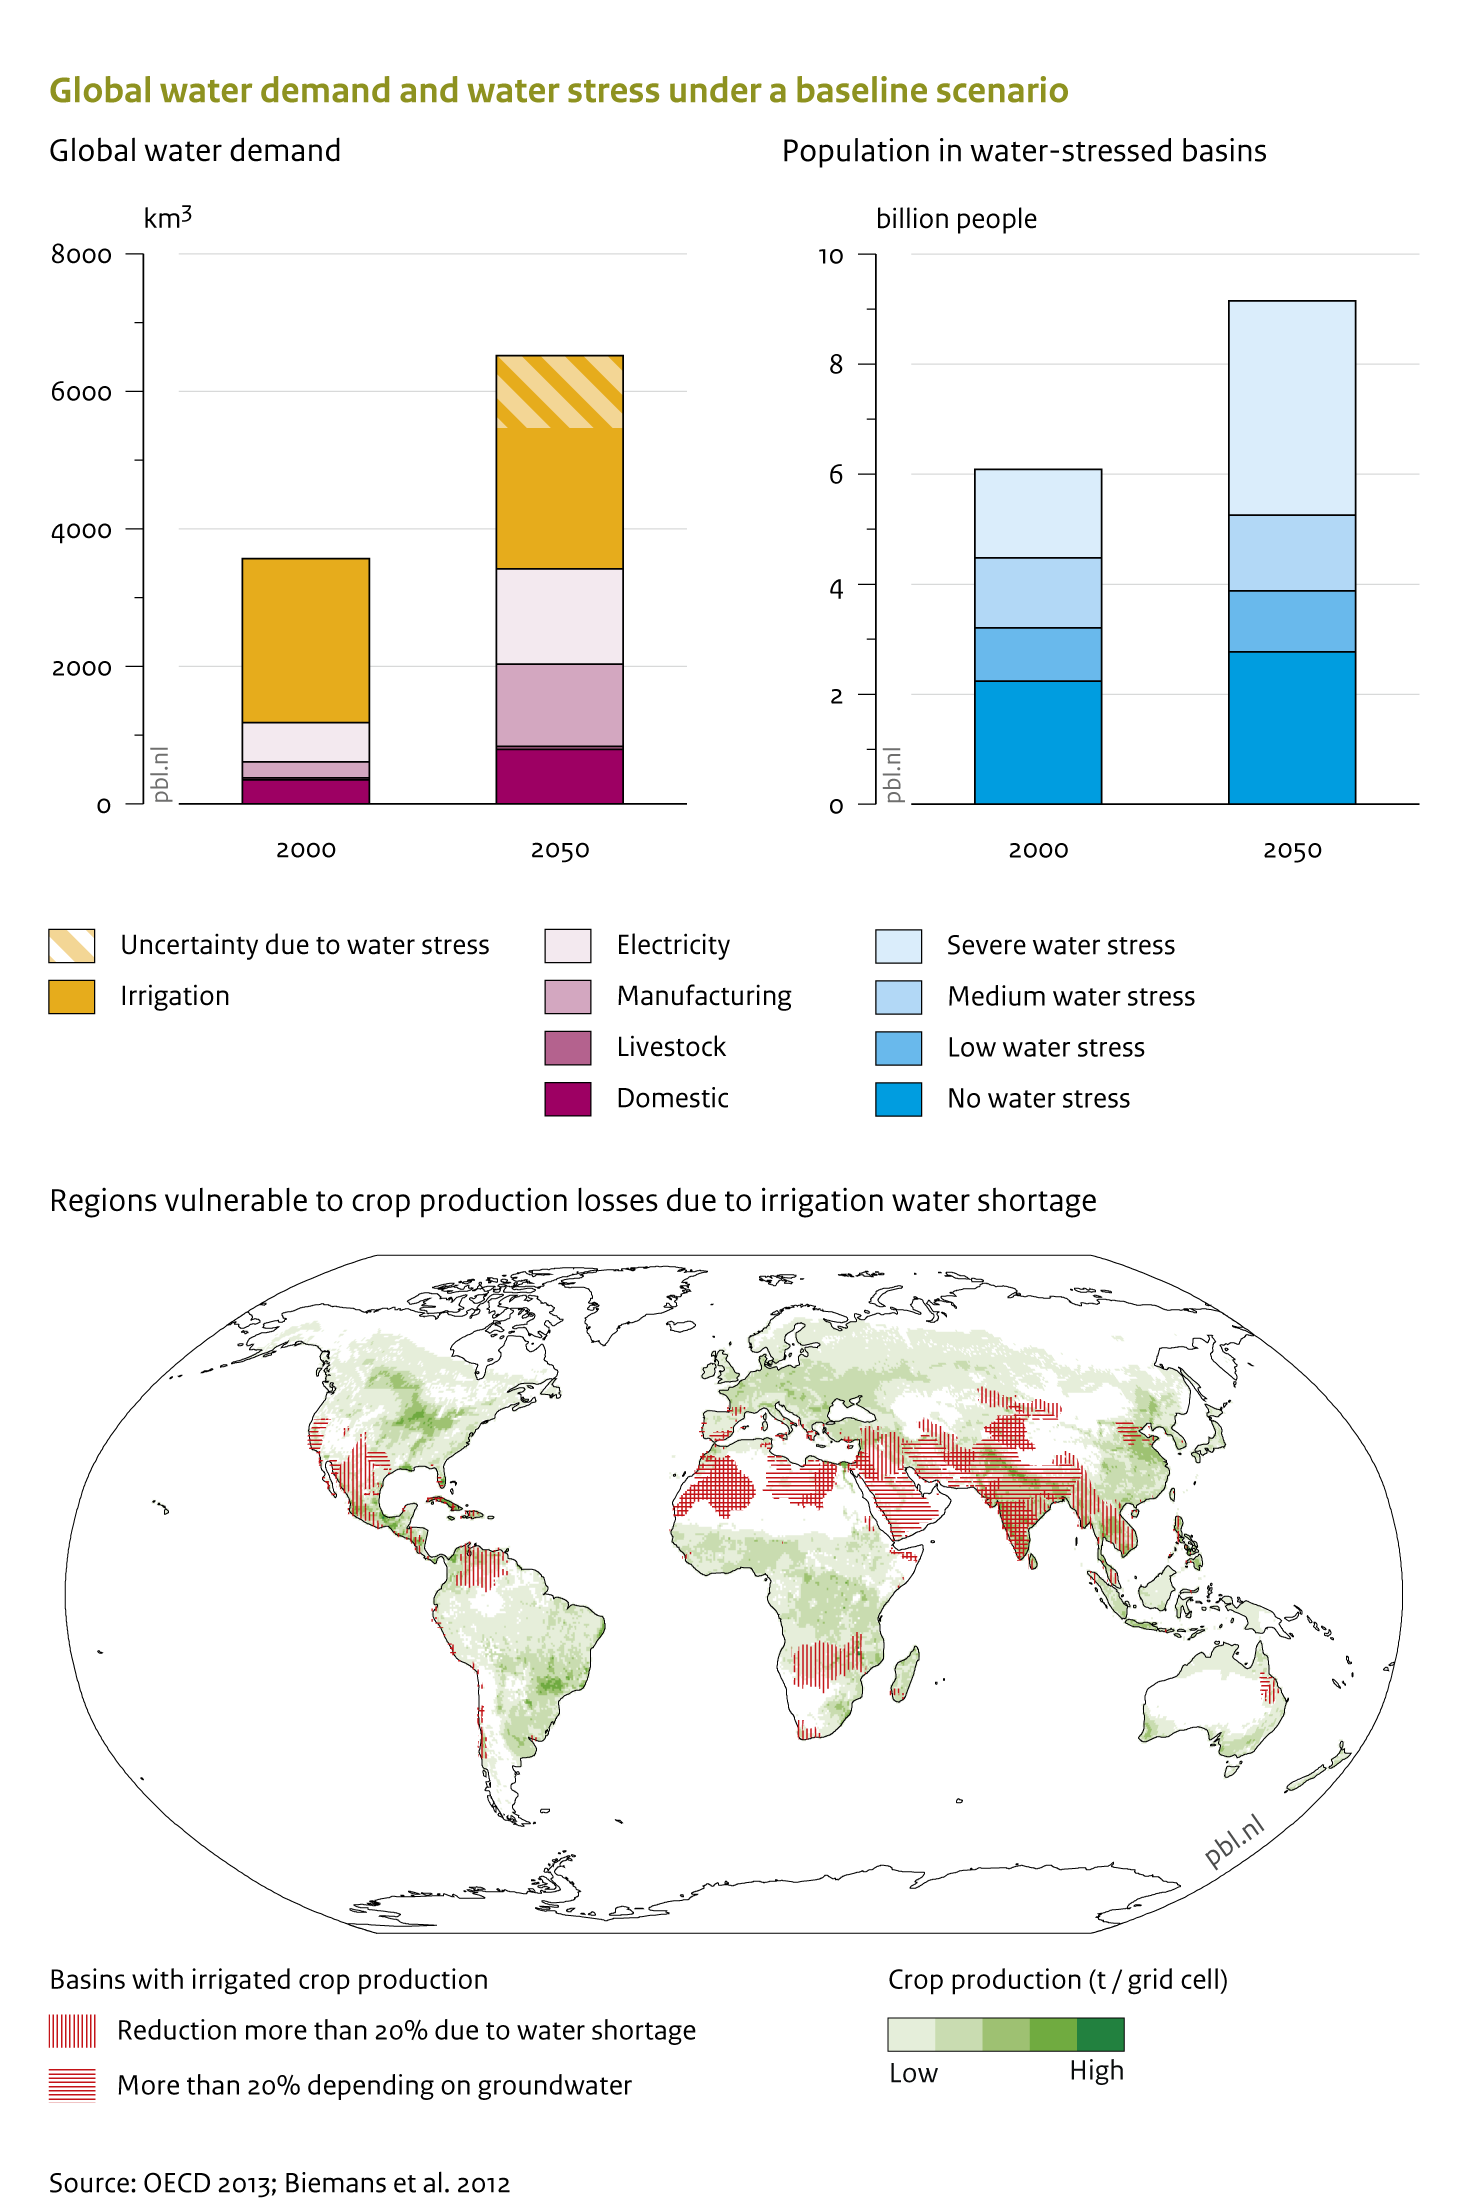
|Caption=a | |AltText=Global water demand and water stress under a baseline scenario | ||
|Caption=As a result of increasing water demand and climate change, the number of people living under water stress is projected to increase (top, OECD 2012), and more regions might face a reduction in crop production due to irrigation water shortage (bottom, Biemans 2012). | |||
|FigureType=Baseline figure | |FigureType=Baseline figure | ||
|Component= | |OptimalSize=600 | ||
|Component=Water; | |||
}} | }} | ||
Latest revision as of 15:31, 24 June 2014
Caption: As a result of increasing water demand and climate change, the number of people living under water stress is projected to increase (top, OECD 2012), and more regions might face a reduction in crop production due to irrigation water shortage (bottom, Biemans 2012).
Figure is used on page(s): Water, Water/Description