Policy intervention figure Atmospheric composition and climate: Difference between revisions
Jump to navigation
Jump to search
No edit summary |
m (moved Policy intervention figure ACCM to Policy intervention figure ACC: Text replace - "ACCM" to "ACC") |
(No difference)
| |
Revision as of 15:20, 19 December 2013
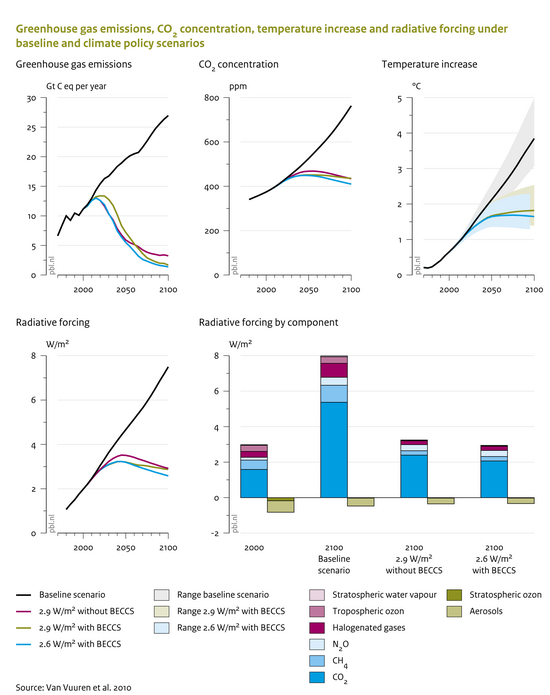
Caption: Greenhouse gas emissions, CO2 concentration levels, radiative forcing, and temperature increase under a baseline and three climate policy scenarios (based on Van Vuuren et al. 2010). In the policy scenarios, emissions decrease strongly after 2020, while concentration levels only decrease or stabilise after 2050. Global mean temperature is, due to inertia in the global mean temperature, only stabilising at the end of the century in the most ambitious climate policy scenario (2.6 W/m2).
Figure is used on page(s): Atmospheric composition and climate
View Image "550" is not in the list (0, 240, 300, 400, 500, 600, 800) of allowed values for the "HasOptimalSize" property.