Policy intervention figure Nutrients: Difference between revisions
Jump to navigation
Jump to search
No edit summary |
(CSV import) |
||
| Line 1: | Line 1: | ||
{{FigureTemplate | {{FigureTemplate | ||
|Figure=146g img13.png | |Figure=146g img13.png | ||
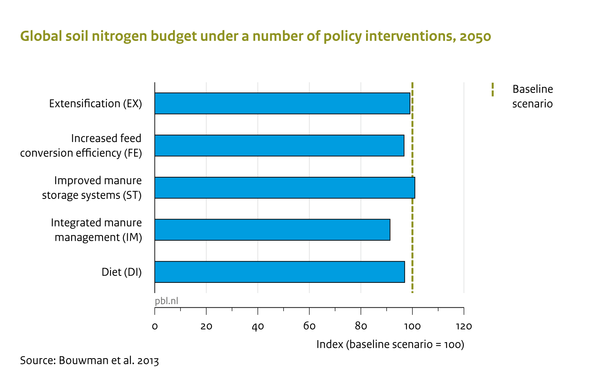
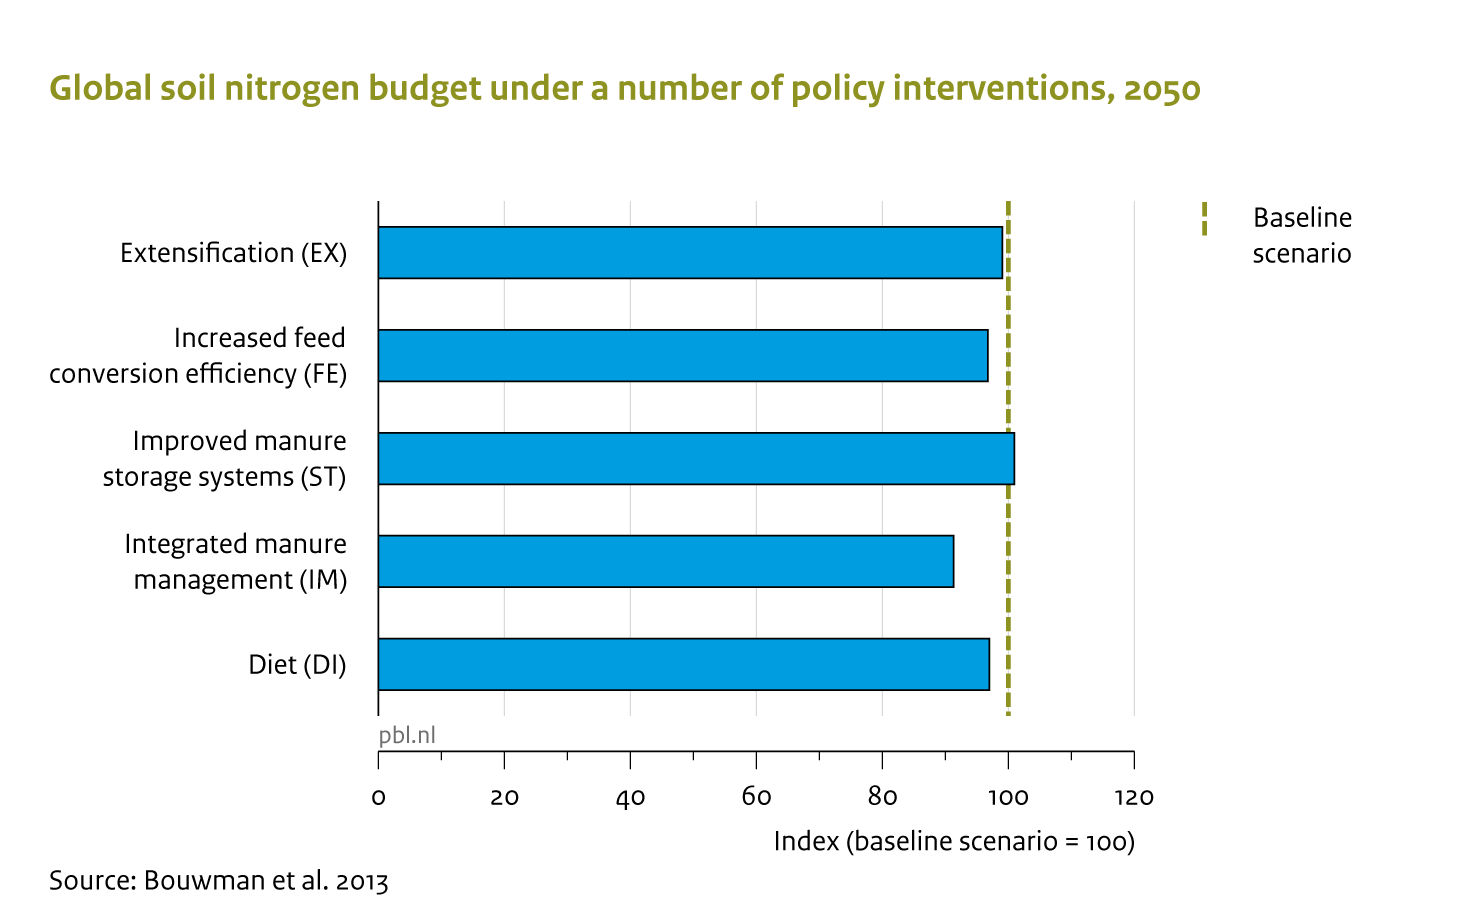
|AltText=Global soil nitrogen budget under a number of policy interventions | |AltText=Global soil nitrogen budget under a number of policy interventions, 2050 | ||
|Caption=Several policy interventions can lead to a reduction in the global soil nitrogen budget | |Caption=Several policy interventions can lead to a reduction in the global soil nitrogen budget compared to a baseline scenario (Bouwman et al., 2013c). | ||
|FigureType=Policy intervention figure | |FigureType=Policy intervention figure | ||
|OptimalSize=600 | |OptimalSize=600 | ||
|Component=Nutrients; | |Component=Nutrients; | ||
}} | }} | ||
Revision as of 13:43, 23 May 2014
Caption: Several policy interventions can lead to a reduction in the global soil nitrogen budget compared to a baseline scenario (Bouwman et al., 2013c).
Figure is used on page(s): Nutrients