Baseline figure Drivers: Difference between revisions
Jump to navigation
Jump to search
Oostenrijr (talk | contribs) m (Oostenrijr moved page Baseline figure D to Baseline figure Drivers without leaving a redirect: Text replace - "D" to "Drivers") |
Dafnomilii (talk | contribs) (Changed based on Detlef's input) |
||
| Line 2: | Line 2: | ||
|Figure=142g img13.png | |Figure=142g img13.png | ||
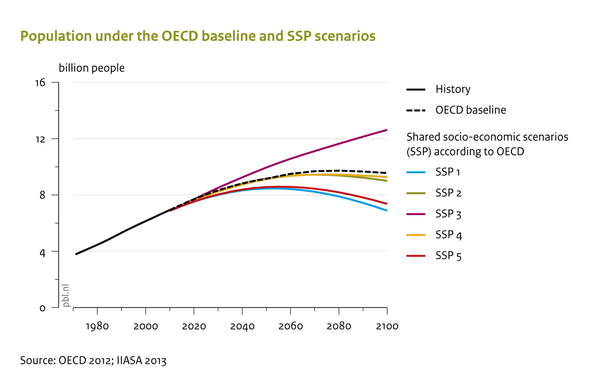
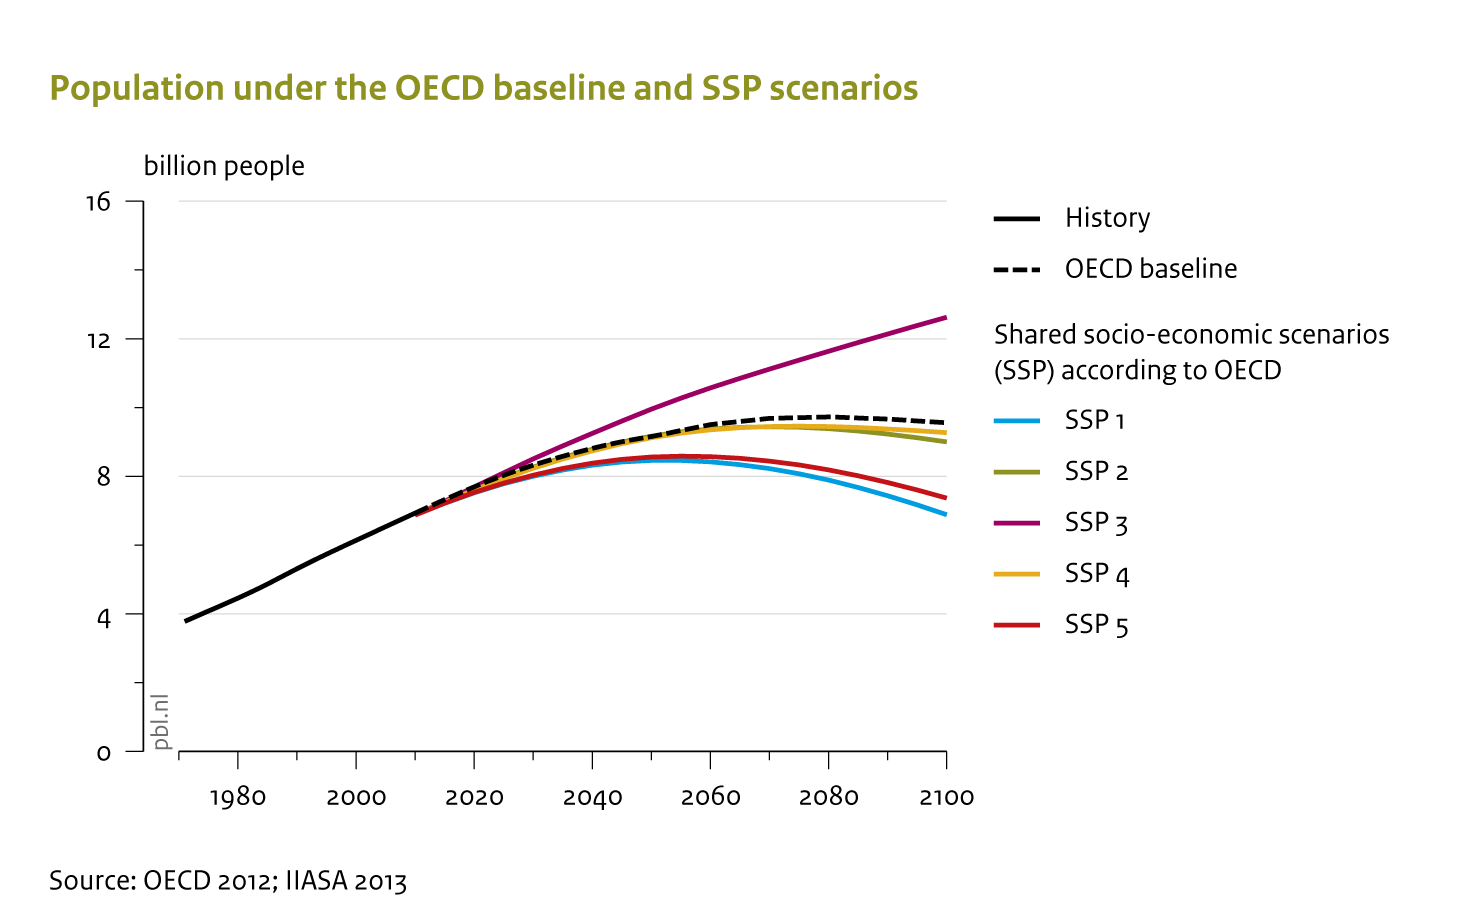
|AltText=Population under the OECD baseline and SSP scenarios | |AltText=Population under the OECD baseline and SSP scenarios | ||
|Caption= | |Caption=The total global population is projected to peak and then decline in the coming century, except under the high-end assumptions (SSP3). By 2100, the population may range between the current and twice as many as in 2000 in the SSPs. The OECD Outlook assumes an intermediate population growth trajectory, close to the medium population SSP scenarios. | ||
|FigureType=Baseline figure | |FigureType=Baseline figure | ||
|OptimalSize=600 | |OptimalSize=600 | ||
|Component=Drivers; | |Component=Drivers; | ||
}} | }} | ||
Latest revision as of 11:08, 8 October 2021
Caption: The total global population is projected to peak and then decline in the coming century, except under the high-end assumptions (SSP3). By 2100, the population may range between the current and twice as many as in 2000 in the SSPs. The OECD Outlook assumes an intermediate population growth trajectory, close to the medium population SSP scenarios.
Figure is used on page(s): Drivers