Flowchart Nutrients: Difference between revisions
Jump to navigation
Jump to search

Oostenrijr (talk | contribs) m (Oostenrijr moved page Flowchart N to Flowchart Nutrients without leaving a redirect: Text replace - "N" to "Nutrients") |
Oostenrijr (talk | contribs) No edit summary |
||
| Line 2: | Line 2: | ||
|Figure=149x img13.png | |Figure=149x img13.png | ||
|AltText=Nutrient module of IMAGE 3.0 | |AltText=Nutrient module of IMAGE 3.0 | ||
|Caption= | |Caption={{PAGENAME}}. See also the Input/Output Table on the introduction page. | ||
|FigureType=Flowchart | |FigureType=Flowchart | ||
|OptimalSize=800 | |OptimalSize=800 | ||
Latest revision as of 17:09, 24 June 2014
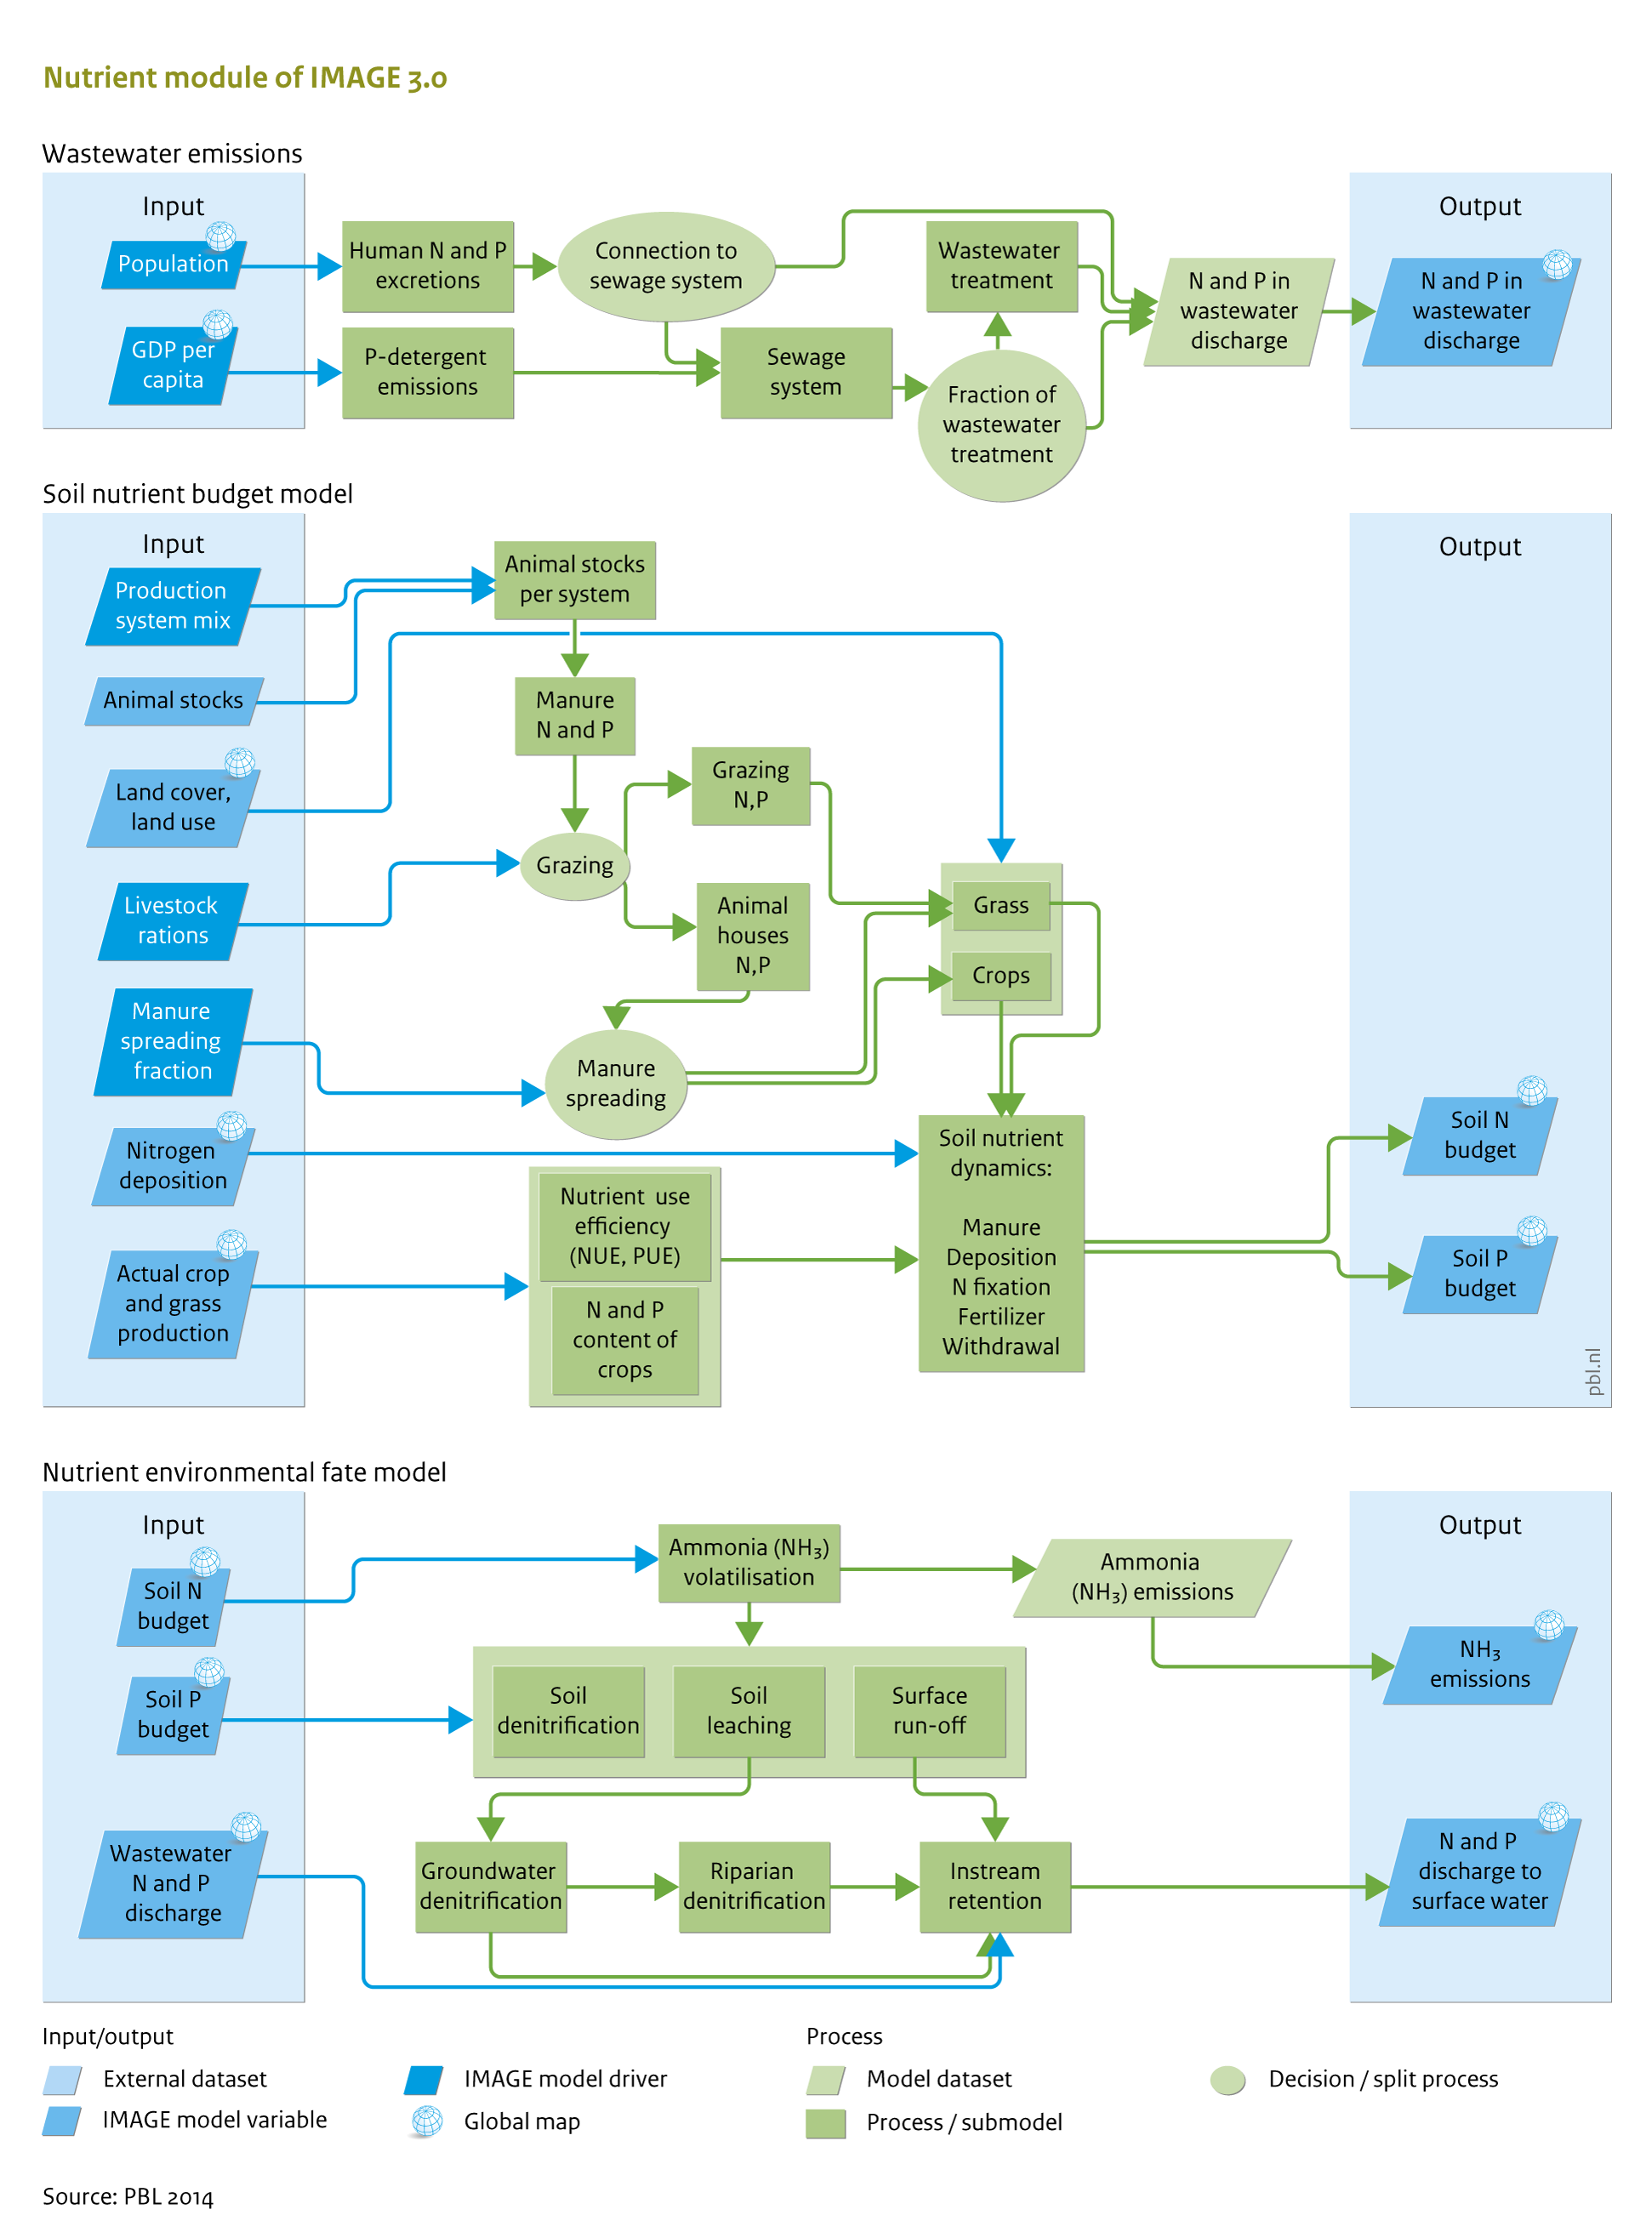
Caption: Flowchart Nutrients. See also the Input/Output Table on the introduction page.
Figure is used on page(s): Nutrients
(a) Wastewater nutrient model that generates N and P discharge to surface water; (b) Soil nutrient budget model; (c) Nutrient environmental fate model that describes N and P in the environment, including the pathways and processes of surface N and P runoff; soil denitrification; leaching of N to groundwater; groundwater transport and denitrification; denitrification in the riparian zone (the interface between land and streams or rivers); discharge to streams and rivers; N and P retention (in streams, rivers, lakes, wetlands and reservoirs).