Baseline figure Human development: Difference between revisions
Jump to navigation
Jump to search
m (Text replace - "FigurePage" to "Figure") |
No edit summary |
||
| Line 4: | Line 4: | ||
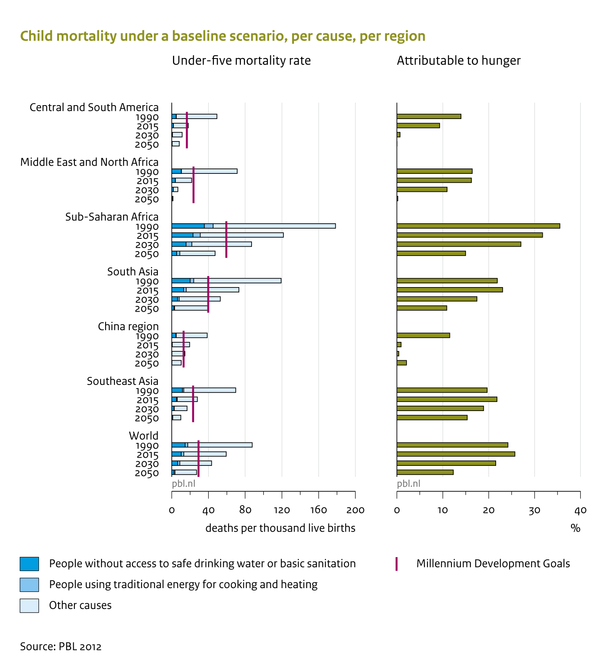
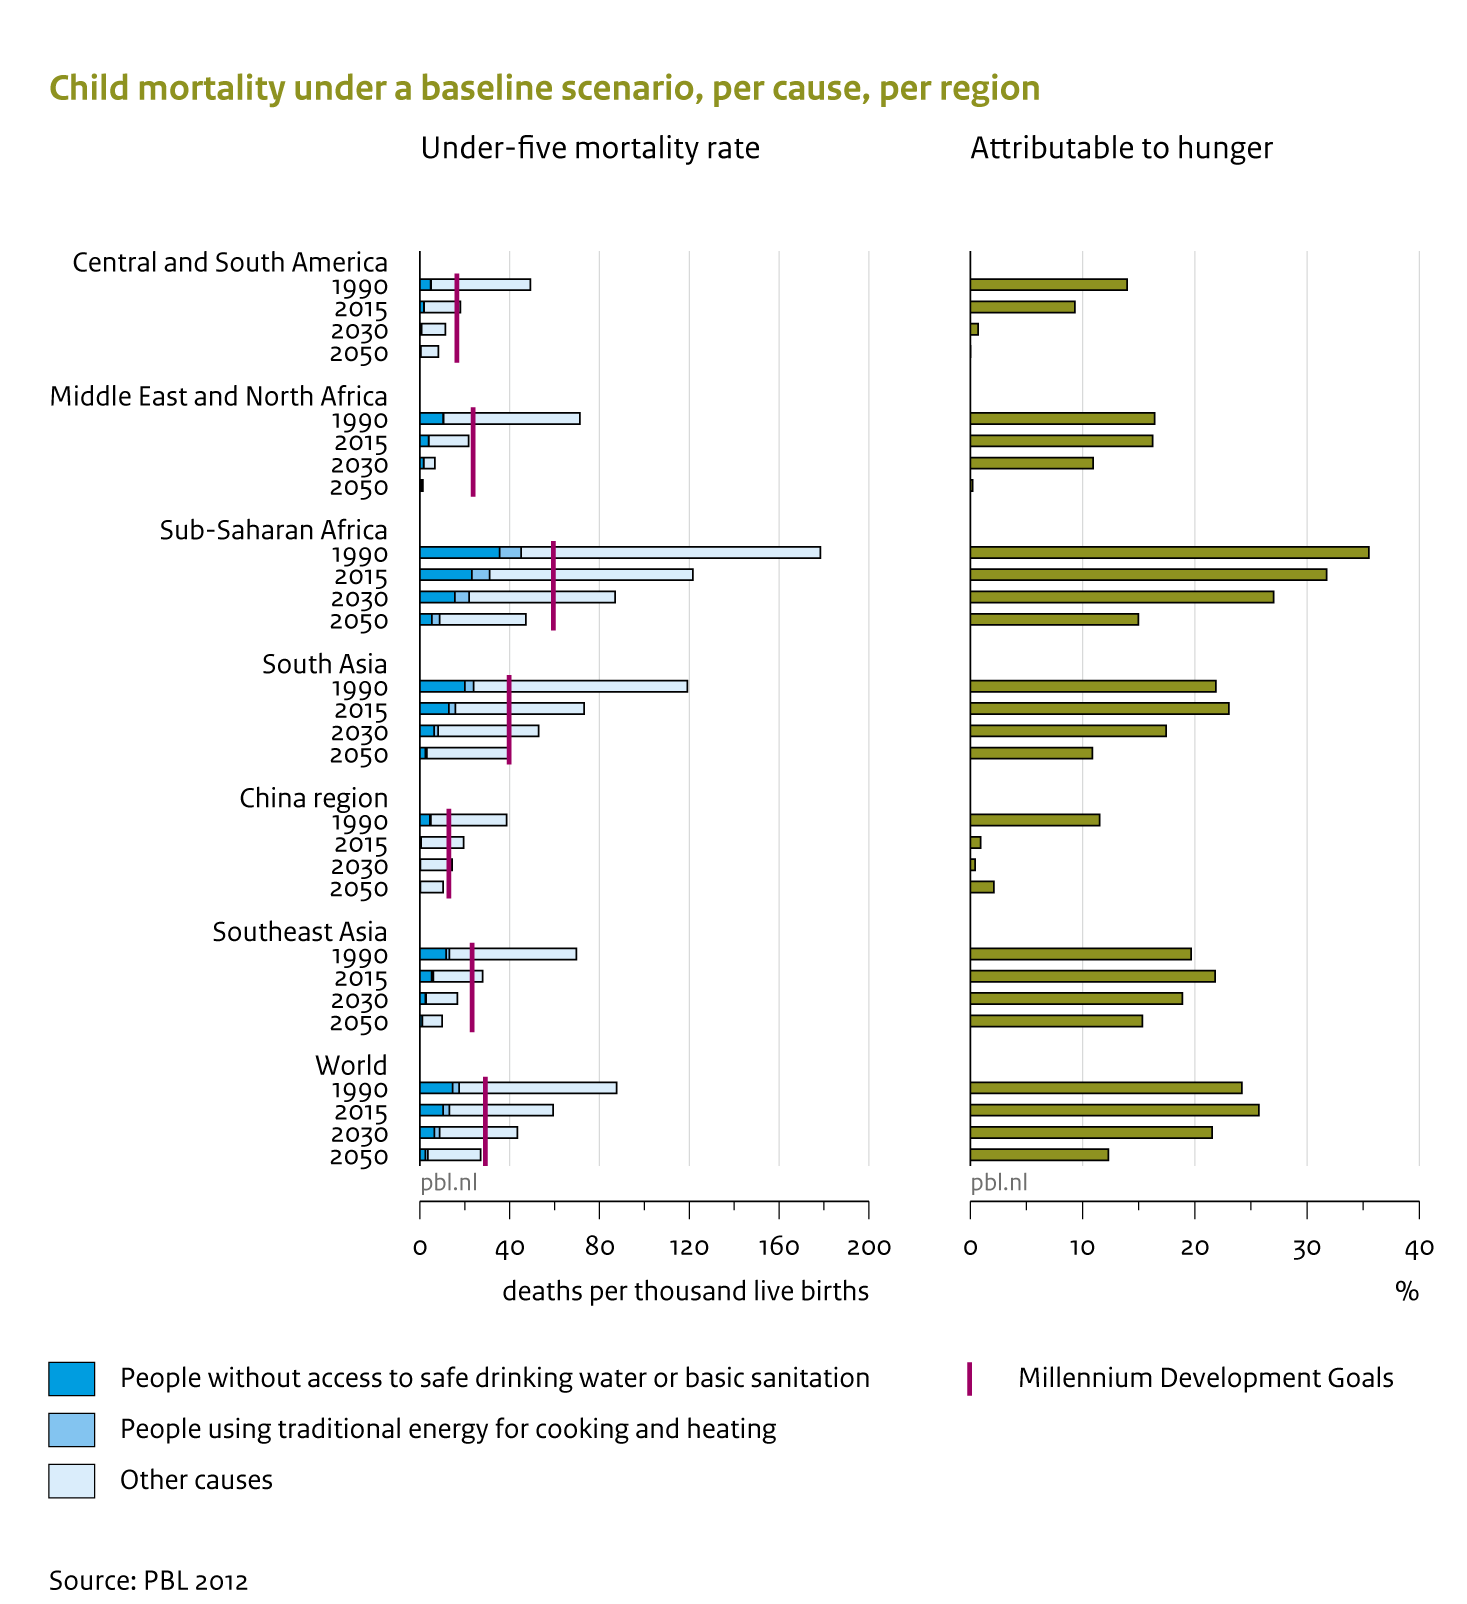
|Caption=Future developments and causes of child mortality and MDG achievement. The under-five mortality rates are shown with the fractions due to no access to save drinking water and improved sanitation, and the use of traditional energy sources for cooking and heating (left). The share of total child deaths related to child underweight is shown on the right. | |Caption=Future developments and causes of child mortality and MDG achievement. The under-five mortality rates are shown with the fractions due to no access to save drinking water and improved sanitation, and the use of traditional energy sources for cooking and heating (left). The share of total child deaths related to child underweight is shown on the right. | ||
|FigureType=Baseline figure | |FigureType=Baseline figure | ||
|OptimalSize=600 | |||
|Component=Human development; | |Component=Human development; | ||
}} | }} | ||
Revision as of 22:27, 9 December 2013
Caption: Future developments and causes of child mortality and MDG achievement. The under-five mortality rates are shown with the fractions due to no access to save drinking water and improved sanitation, and the use of traditional energy sources for cooking and heating (left). The share of total child deaths related to child underweight is shown on the right.
Figure is used on page(s): Human development