Policy intervention figure Climate policy: Difference between revisions
Jump to navigation
Jump to search
m (Text replace - "FigurePage" to "Figure") |
No edit summary |
||
| Line 3: | Line 3: | ||
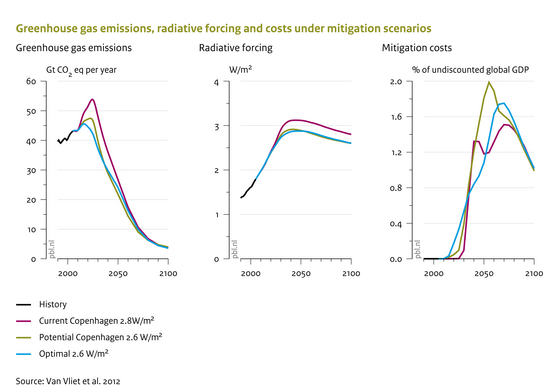
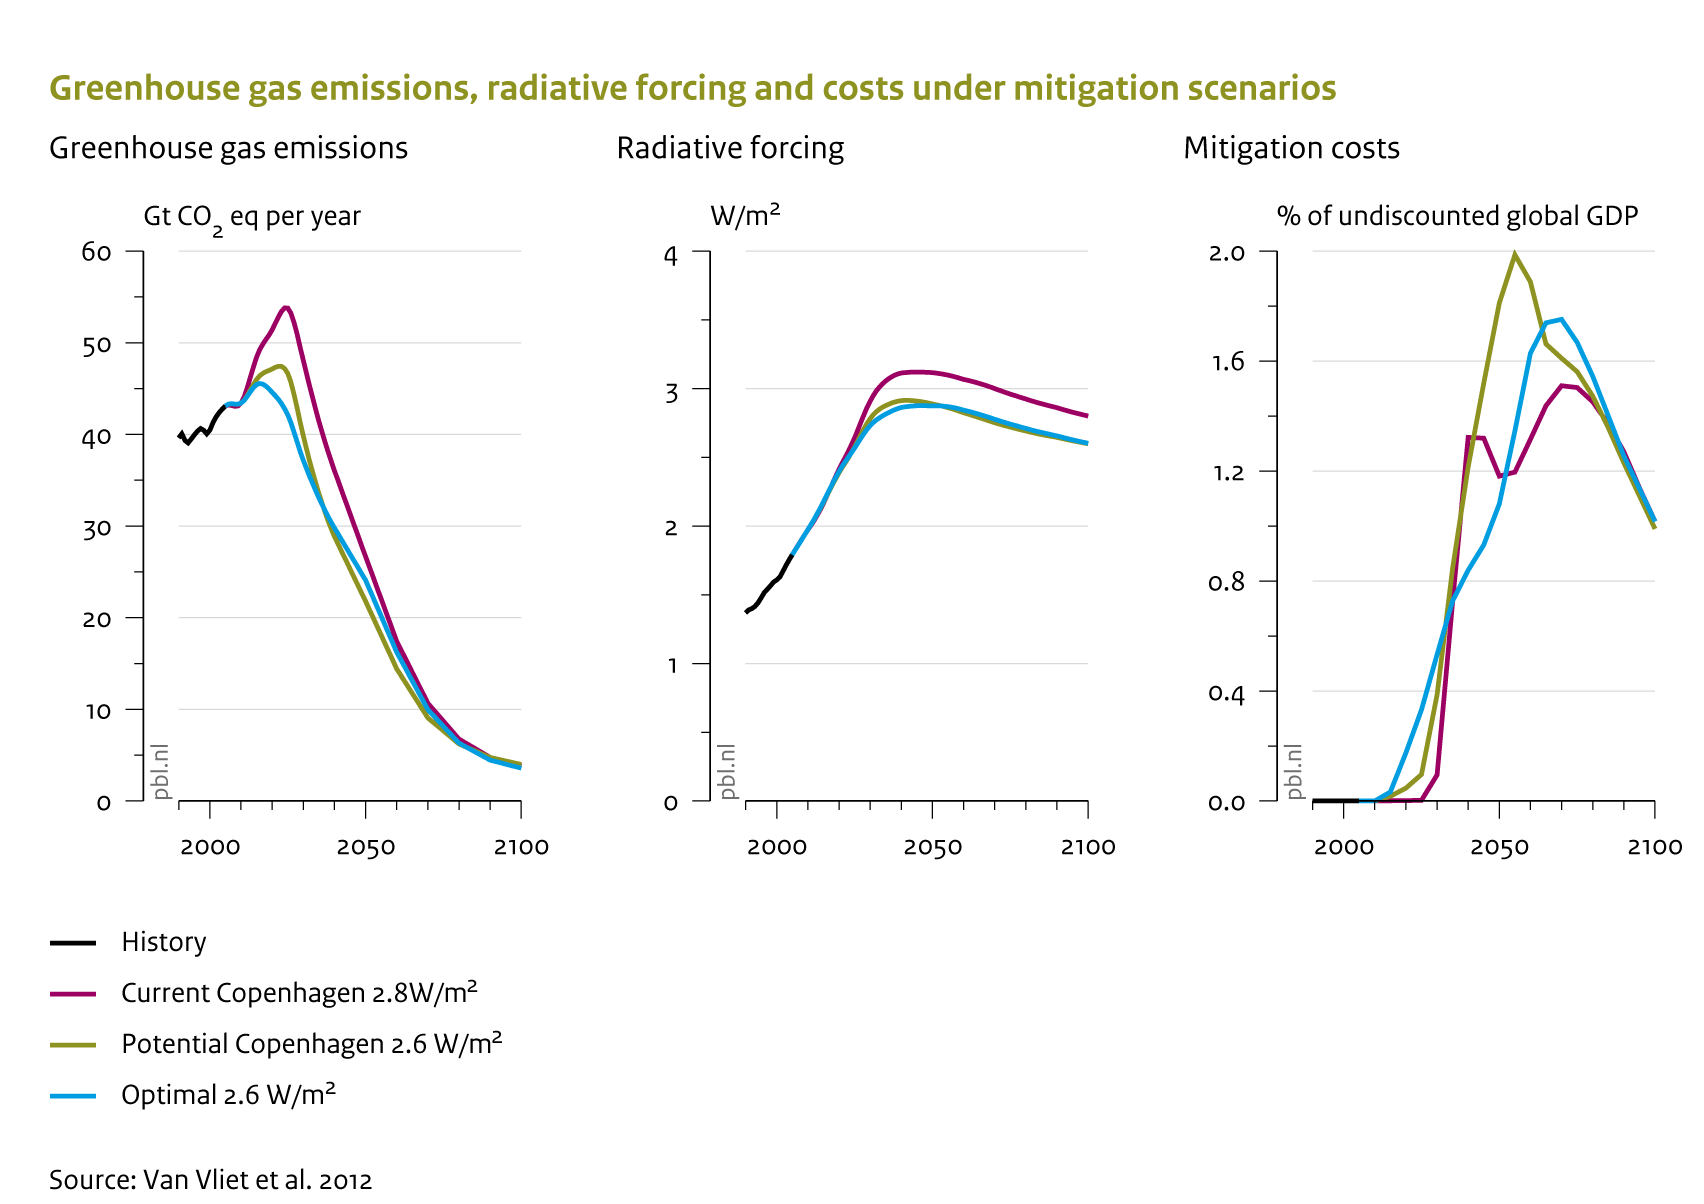
|Caption=Scenario results describing Kyoto greenhouse gas emissions pathways representing optimal and delayed policy action in 2020 (including land use CO2) (left), associated radiative forcing (including all gases and aerosol forcings) (middle) and global mitigation costs as percentage of GDP (right)(van Vliet, van den Berg et al. 2012) | |Caption=Scenario results describing Kyoto greenhouse gas emissions pathways representing optimal and delayed policy action in 2020 (including land use CO2) (left), associated radiative forcing (including all gases and aerosol forcings) (middle) and global mitigation costs as percentage of GDP (right)(van Vliet, van den Berg et al. 2012) | ||
|FigureType=Policy intervention figure | |FigureType=Policy intervention figure | ||
|OptimalSize=550 | |||
|Component=Climate policy; | |Component=Climate policy; | ||
}} | }} | ||
Revision as of 13:50, 17 December 2013
Caption: Scenario results describing Kyoto greenhouse gas emissions pathways representing optimal and delayed policy action in 2020 (including land use CO2) (left), associated radiative forcing (including all gases and aerosol forcings) (middle) and global mitigation costs as percentage of GDP (right)(van Vliet, van den Berg et al. 2012)
Figure is used on page(s): Climate policy
View Image "550" is not in the list (0, 240, 300, 400, 500, 600, 800) of allowed values for the "HasOptimalSize" property.