Baseline figure Drivers: Difference between revisions
Jump to navigation
Jump to search

m (Text replace - "Drivers" to "Scenario drivers") |
No edit summary |
||
| Line 3: | Line 3: | ||
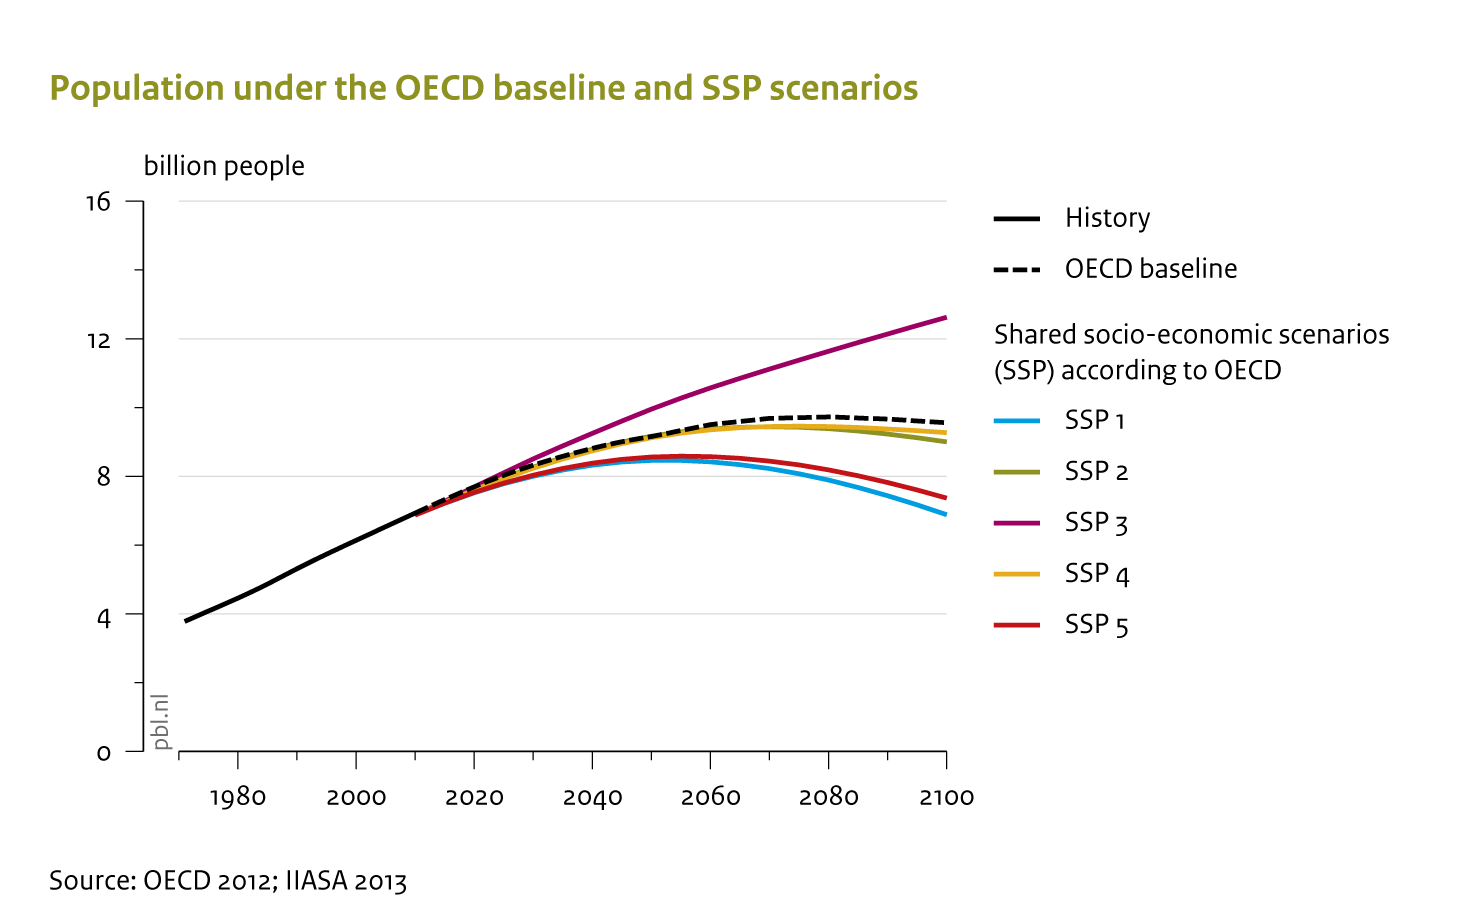
|AltText=Population in OECD outlook and projected by OECD for the five SSP scenarios | |AltText=Population in OECD outlook and projected by OECD for the five SSP scenarios | ||
|Caption=The total global population is projected to peak and decline in the coming century, except under the high end assumptions (SSP3). By 2100 the number of people may range between the current level and two times more than in 2000 in the SSPs. The OECD Outlook assumes an intermediate population growth trajectory, close to the medium population SSP scenarios. | |Caption=The total global population is projected to peak and decline in the coming century, except under the high end assumptions (SSP3). By 2100 the number of people may range between the current level and two times more than in 2000 in the SSPs. The OECD Outlook assumes an intermediate population growth trajectory, close to the medium population SSP scenarios. | ||
|FigureType= | |FigureType=Driver figure | ||
|OptimalSize=550 | |||
|Component=Scenario drivers; | |Component=Scenario drivers; | ||
}} | }} | ||
Revision as of 16:49, 17 December 2013
Caption: The total global population is projected to peak and decline in the coming century, except under the high end assumptions (SSP3). By 2100 the number of people may range between the current level and two times more than in 2000 in the SSPs. The OECD Outlook assumes an intermediate population growth trajectory, close to the medium population SSP scenarios.
Figure is used on page(s): Drivers
View Image <ul><li>"Driver figure" is not in the list (Flowchart, Icon, Policy intervention figure, Baseline figure, Other type of figure) of allowed values for the "HasFigureType" property.</li> <!--br--><li>"550" is not in the list (0, 240, 300, 400, 500, 600, 800) of allowed values for the "HasOptimalSize" property.</li></ul>