Baseline figure Water: Difference between revisions
Jump to navigation
Jump to search
No edit summary |
m (Text replace - "Hydrological cycle" to "Water") |
||
| Line 5: | Line 5: | ||
|FigureType=Baseline figure | |FigureType=Baseline figure | ||
|OptimalSize=600 | |OptimalSize=600 | ||
|Component= | |Component=Water; | ||
}} | }} | ||
Revision as of 14:46, 8 May 2014
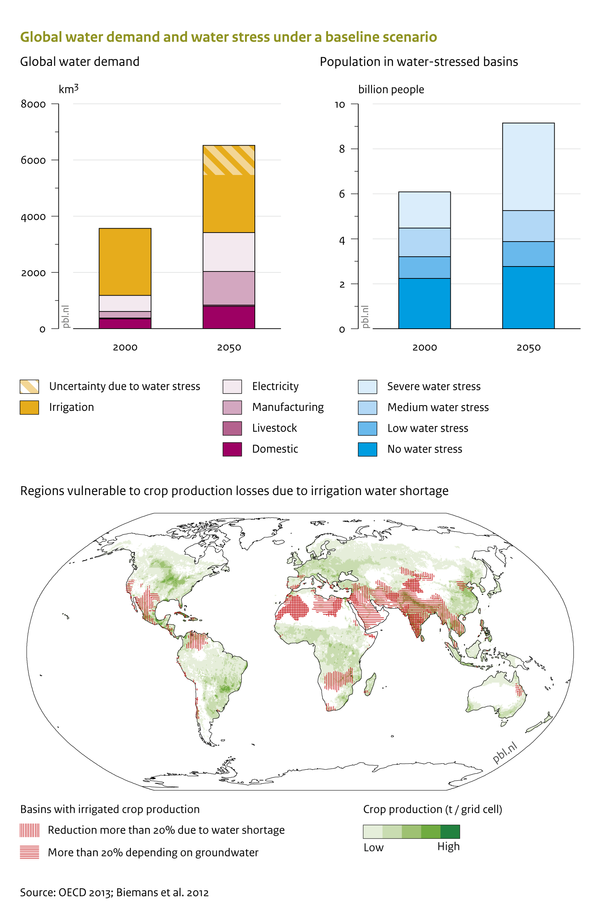
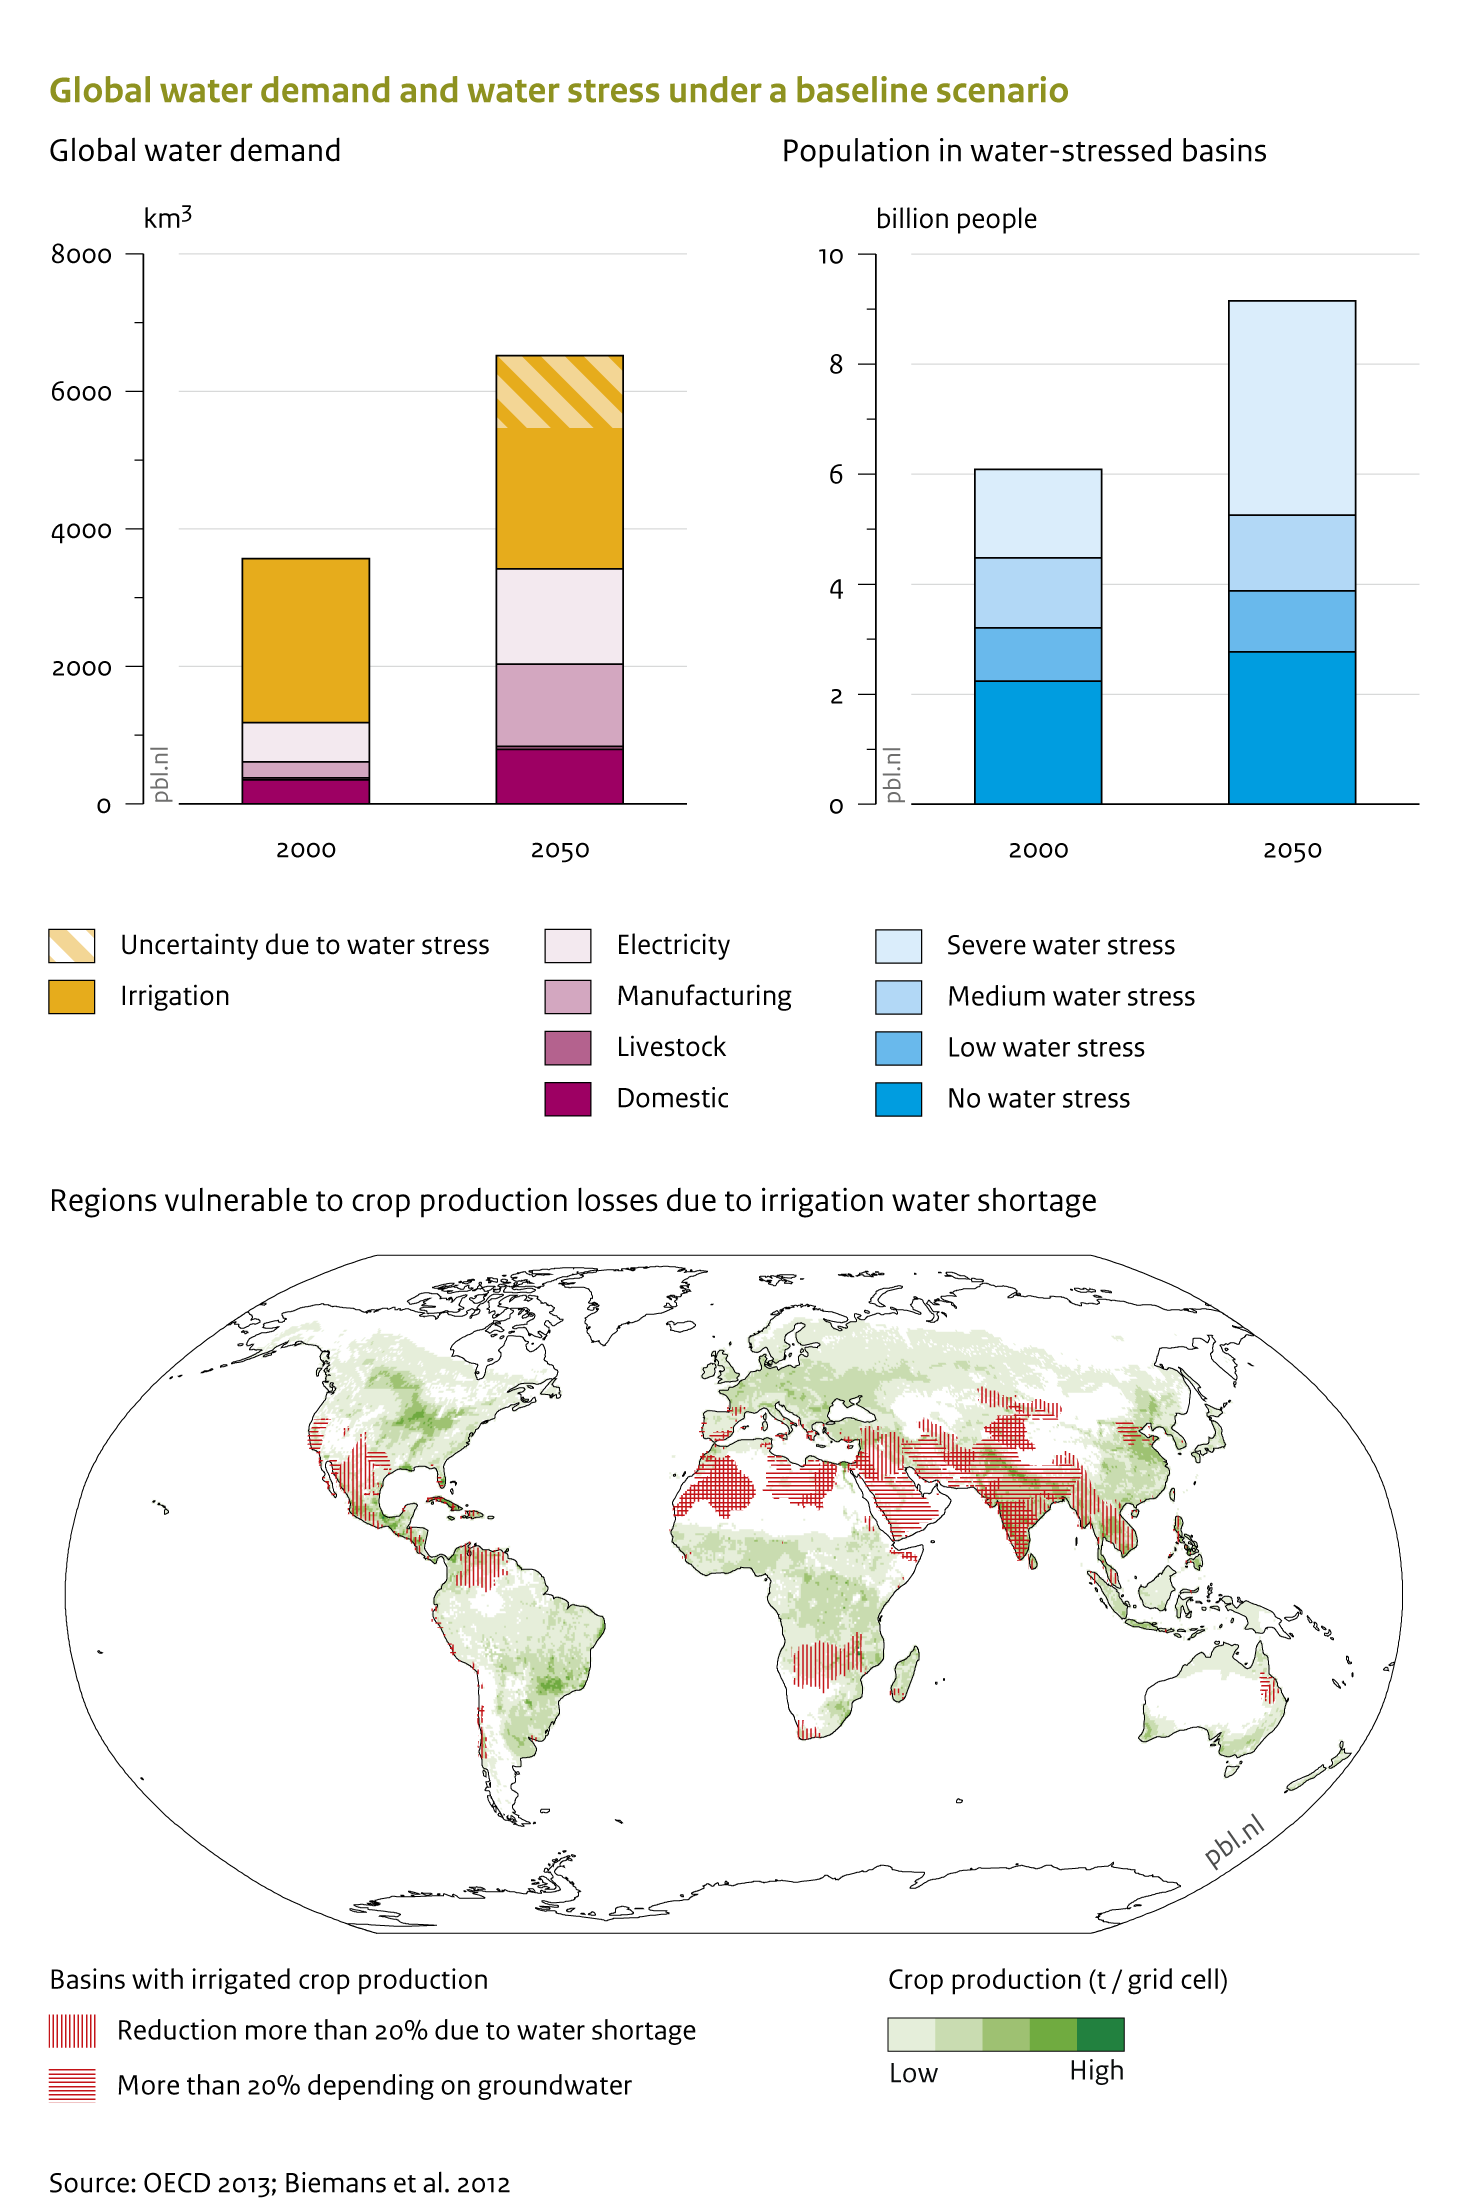
Caption: a (top): global water demand (left) and people living under water stress (right), according to the OECD baseline (OECD 2012). Uncertainty range in irrigation water demand estimated by also including results from Biemans (2012). b (bottom): Regions vulnerable to crop production losses due to irrigation water shortage (IMAGE-LPJmL analysis, Biemans (2012)).
Figure is used on page(s): Water, Water/Description