Policy intervention figure Drivers: Difference between revisions
Jump to navigation
Jump to search
m (RinekeOostenrijk moved page Driver figure III to Policy intervention figure D without leaving a redirect) |
No edit summary |
||
| Line 1: | Line 1: | ||
{{FigureTemplate | {{FigureTemplate | ||
|Figure= | |Figure=143x img13.png | ||
|AltText=Global primary energy supply | |AltText=Global primary energy supply | ||
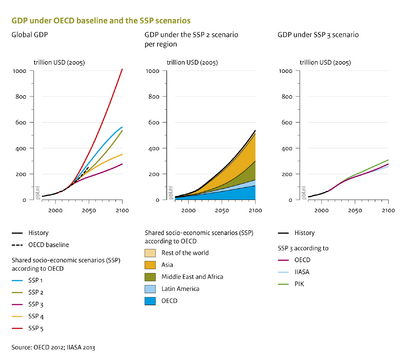
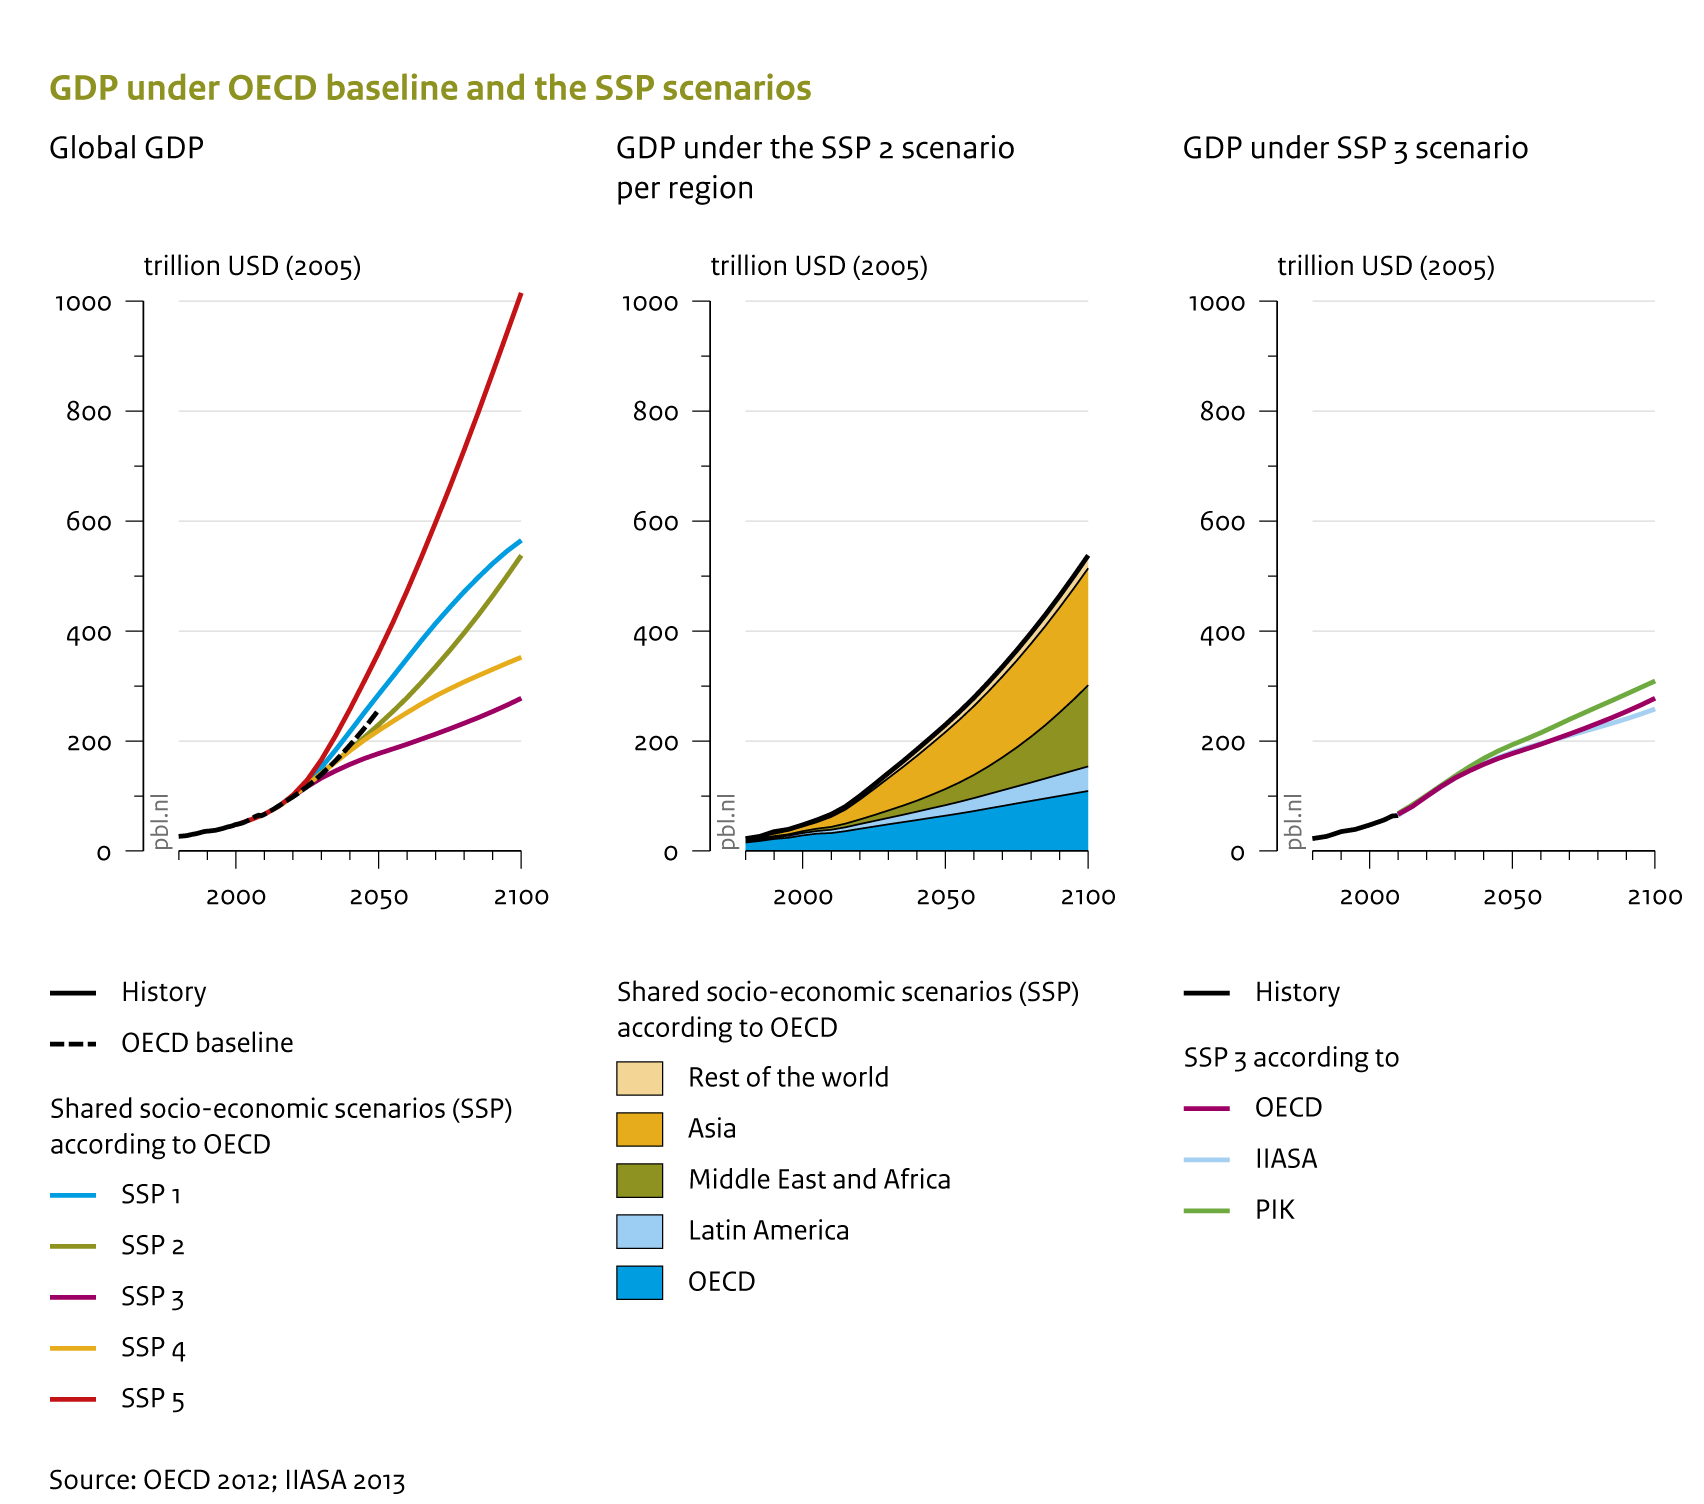
|Caption=c) Projected total GDPppp for the world in the SSP scenarios (GDP = Gross Domestic Product; ppp = purchasing power parity) show different levels and different dynamics over time, in particular in the second half of the century. Up to 2050 the projection used in the OECD Outlook is in the middle of the SSP range, but in the second half it is in between the middle (SSP2) and high-end (SSP5) of the more recent projections | |Caption=c) Projected total GDPppp for the world in the SSP scenarios (GDP = Gross Domestic Product; ppp = purchasing power parity) show different levels and different dynamics over time, in particular in the second half of the century. Up to 2050 the projection used in the OECD Outlook is in the middle of the SSP range, but in the second half it is in between the middle (SSP2) and high-end (SSP5) of the more recent projections | ||
|FigureType= | |FigureType=Policy intervention figure | ||
|OptimalSize=400 | |OptimalSize=400 | ||
|Component=Scenario drivers; | |Component=Scenario drivers; | ||
}} | }} | ||
Revision as of 16:18, 9 May 2014
Caption: c) Projected total GDPppp for the world in the SSP scenarios (GDP = Gross Domestic Product; ppp = purchasing power parity) show different levels and different dynamics over time, in particular in the second half of the century. Up to 2050 the projection used in the OECD Outlook is in the middle of the SSP range, but in the second half it is in between the middle (SSP2) and high-end (SSP5) of the more recent projections
Figure is used on page(s): Drivers