Baseline figure Carbon cycle and natural vegetation: Difference between revisions
Jump to navigation
Jump to search
No edit summary |
No edit summary |
||
| Line 4: | Line 4: | ||
|FigureType=Baseline figure | |FigureType=Baseline figure | ||
|OptimalSize=600 | |OptimalSize=600 | ||
|Component=Natural vegetation and carbon cycle; | |Component=Natural vegetation and carbon cycle; IMAGE framework summary/Earth system | ||
}} | }} | ||
Revision as of 11:17, 12 May 2014
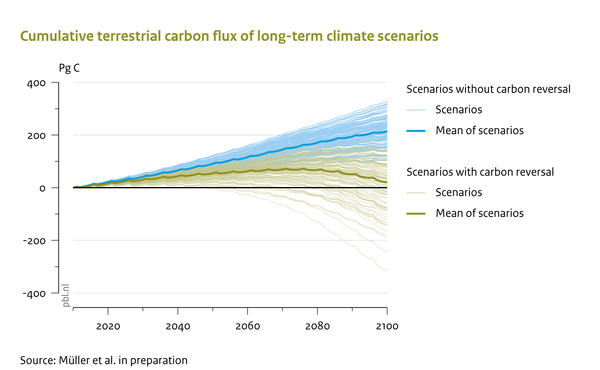
Caption: Cumulative terrestrial carbon flux using the IMAGE-LPJmL model for multiple baselines. Blue lines depict the cases where the total terrestrial biosphere remains a sink, and the green lines show cases where it becomes a carbon source. Positive numbers depict a cumulative terrestrial carbon sink, and negative numbers a cumulative terrestrial source (net carbon release exceeds the amount of carbon sequestered before). Although the terrestrial biosphere has always been a carbon sink, it may become a carbon source in the future (Müller et al., in preparation)
Figure is used on page(s): Carbon cycle and natural vegetation, IMAGE framework summary/Earth system