Policy intervention figure Crops and grass: Difference between revisions
Jump to navigation
Jump to search
No edit summary |
No edit summary |
||
| Line 1: | Line 1: | ||
{{FigureTemplate | {{FigureTemplate | ||
|Figure= | |Figure=079x2 img13.png | ||
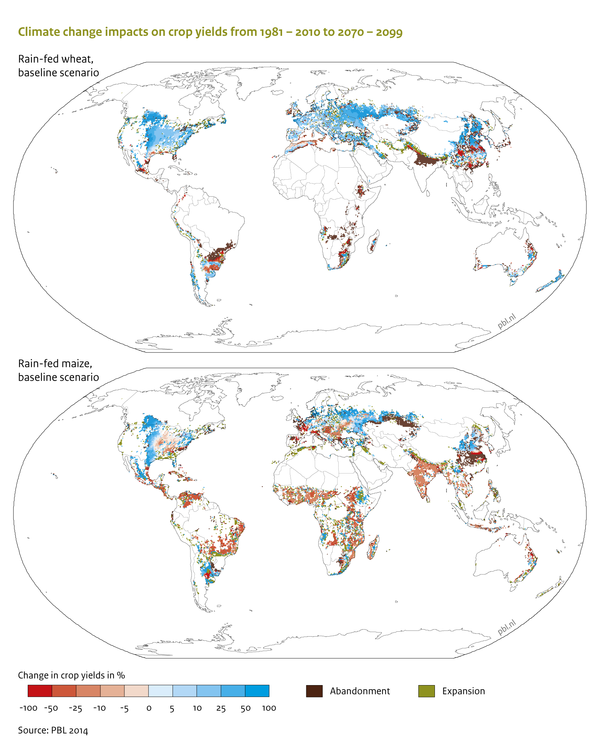
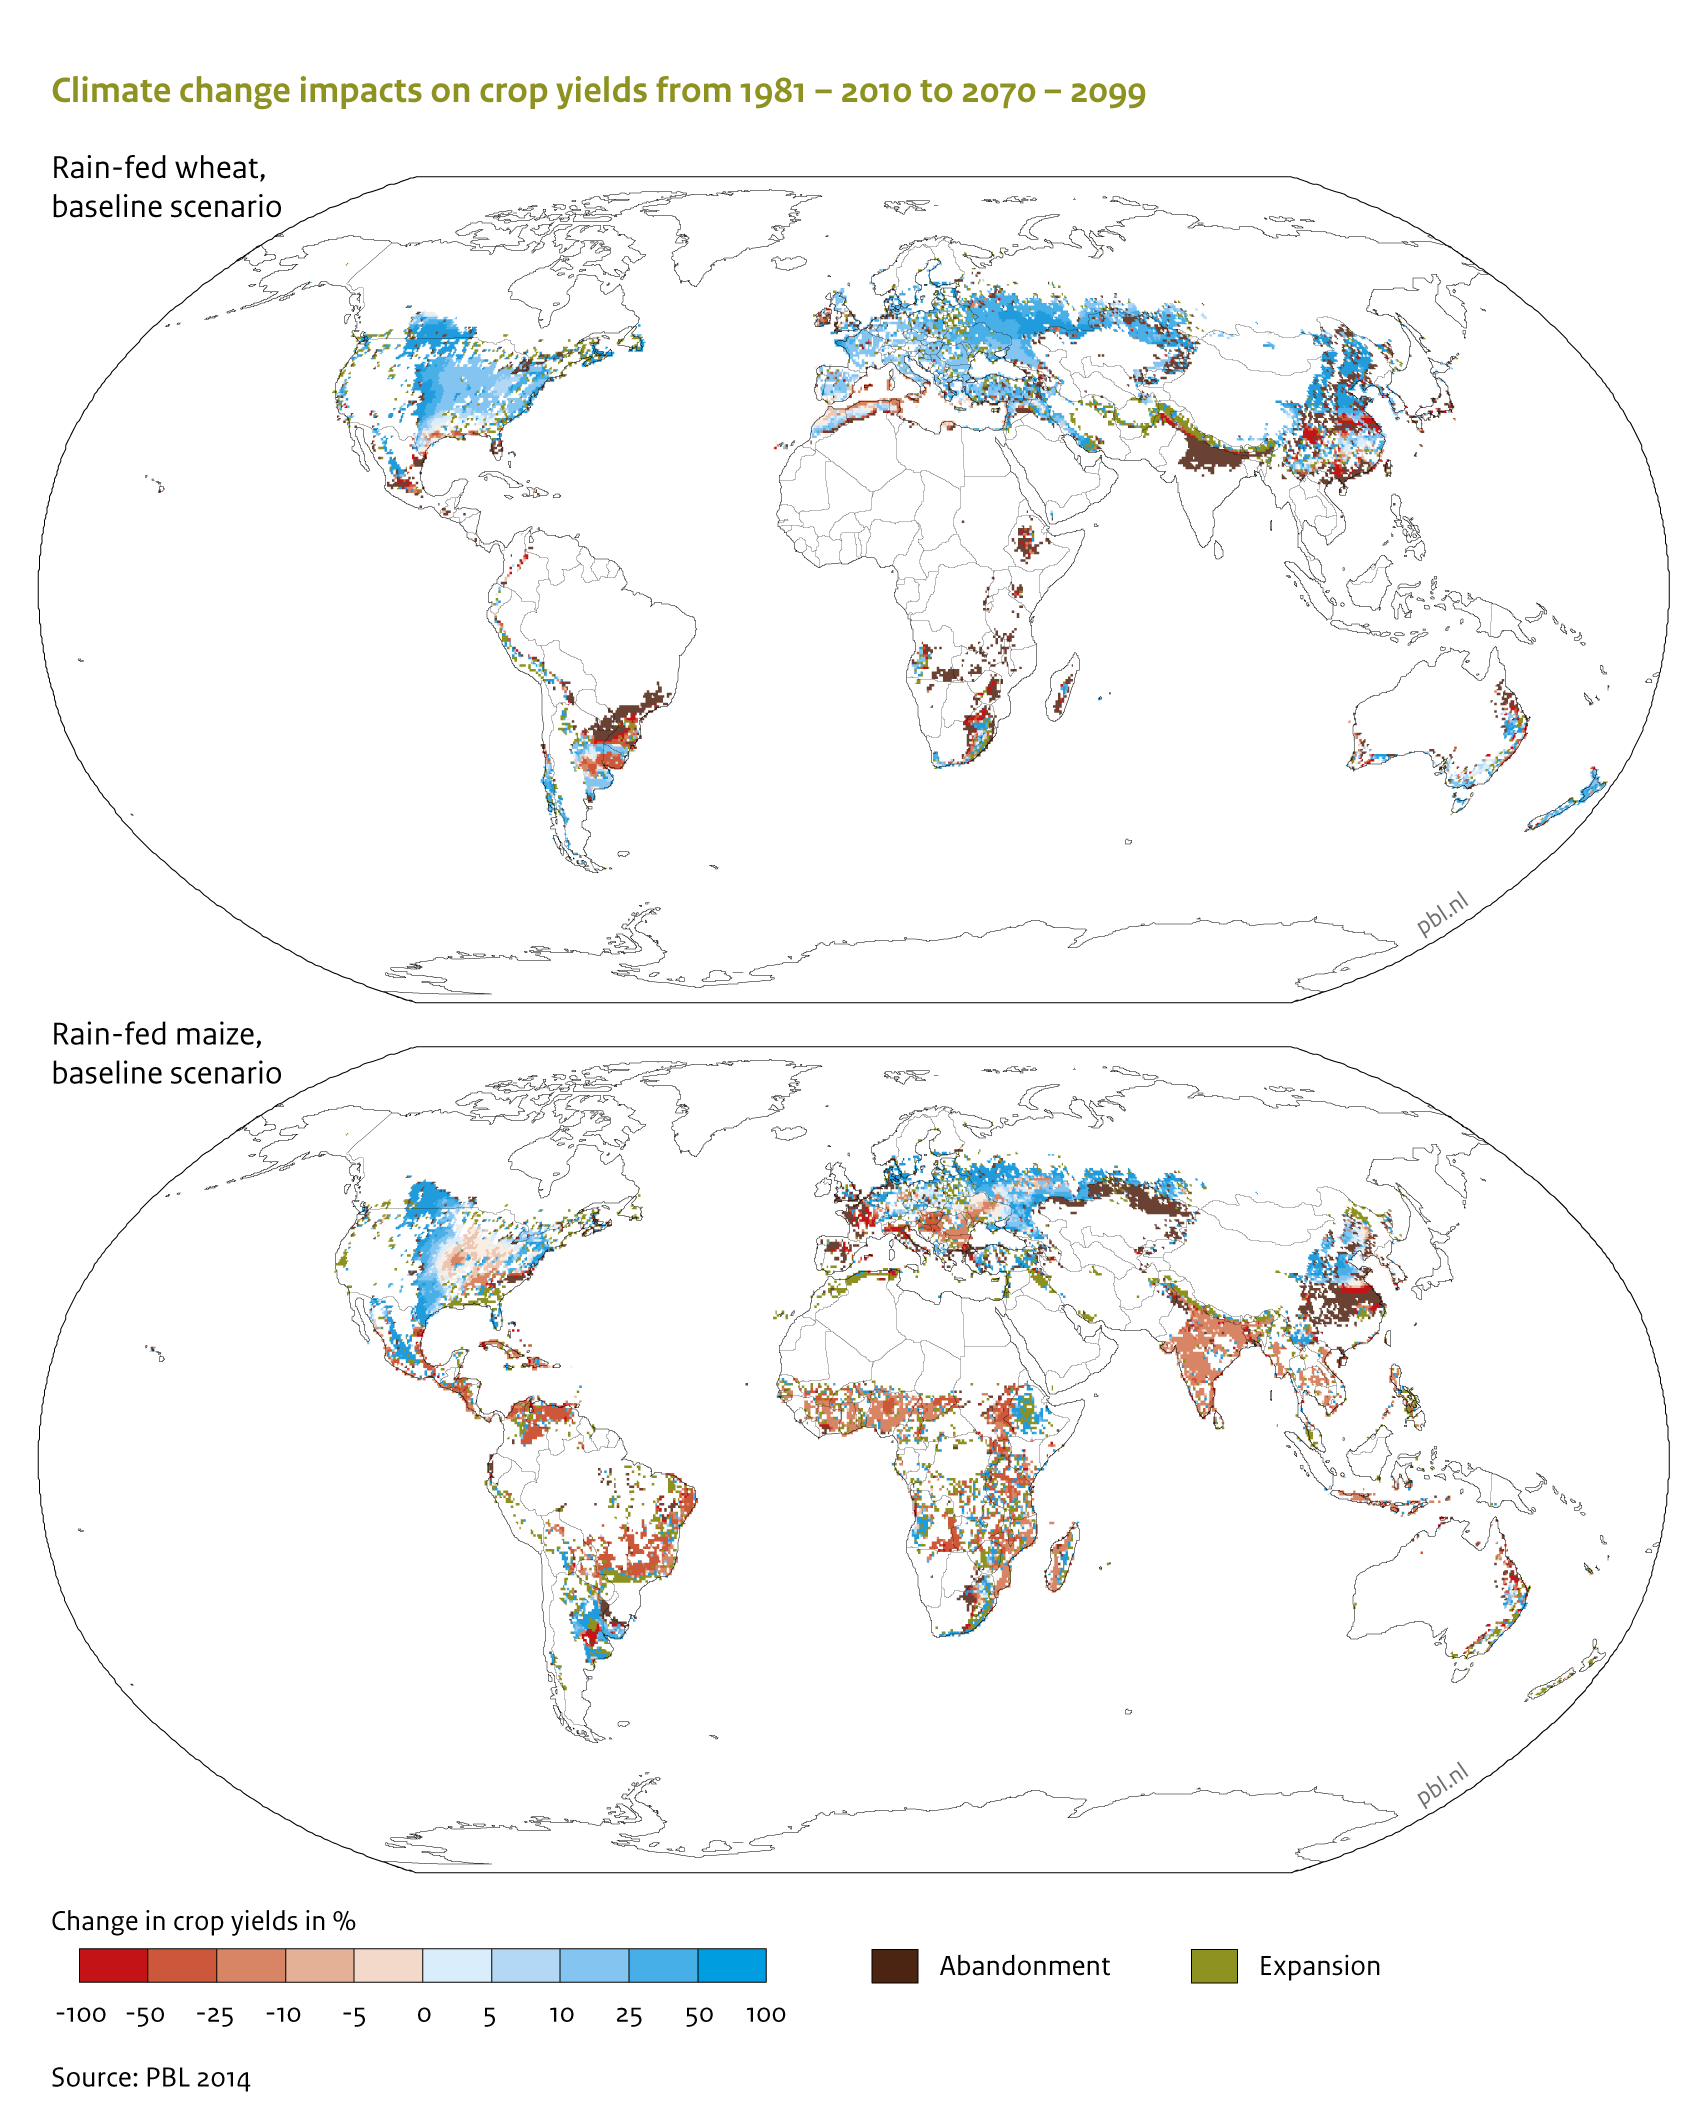
|Caption=Climate change impacts on crop yields in percent from 1981-2010 to 2070-2099 (a: rain-fed wheat, b: irrigated wheat, c: rain-fed maize, d: irrigated maize) under a climate policy scenario (RCP 2.6, HadGEM2 climate pattern, climate sensitivity of 3.0) and associated abandonment (brown) and cropland expansion (purple). | |Caption=Climate change impacts on crop yields in percent from 1981-2010 to 2070-2099 (a: rain-fed wheat, b: irrigated wheat, c: rain-fed maize, d: irrigated maize) under a climate policy scenario (RCP 2.6, HadGEM2 climate pattern, climate sensitivity of 3.0) and associated abandonment (brown) and cropland expansion (purple). | ||
|FigureType=Policy intervention figure | |FigureType=Policy intervention figure | ||
|OptimalSize= | |OptimalSize=600 | ||
|Component=Crops and grass; | |Component=Crops and grass; | ||
}} | }} | ||
Revision as of 13:42, 20 May 2014
Caption: Climate change impacts on crop yields in percent from 1981-2010 to 2070-2099 (a: rain-fed wheat, b: irrigated wheat, c: rain-fed maize, d: irrigated maize) under a climate policy scenario (RCP 2.6, HadGEM2 climate pattern, climate sensitivity of 3.0) and associated abandonment (brown) and cropland expansion (purple).
Figure is used on page(s): Crops and grass