Baseline figure Carbon cycle and natural vegetation: Difference between revisions
Jump to navigation
Jump to search
m (Text replace - "Natural vegetation and carbon cycle" to "Carbon cycle and natural vegetation") |
(CSV import) |
||
| Line 1: | Line 1: | ||
{{FigureTemplate | {{FigureTemplate | ||
|Figure= | |Figure=075g img13.png | ||
|Caption= | |Caption= | ||
|FigureType=Baseline figure | |FigureType=Baseline figure | ||
|OptimalSize=600 | |OptimalSize=600 | ||
|Component=Carbon cycle and natural vegetation; IMAGE framework summary/Earth system | |Component=Carbon cycle and natural vegetation; IMAGE framework summary/Earth system | ||
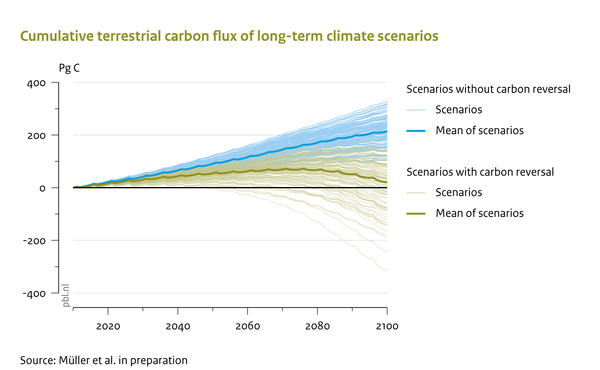
|AltText=Cumulative terrestrial carbon flux of long-term climate scenarios | |||
}} | }} | ||
Revision as of 14:43, 23 May 2014
Figure is used on page(s):
Carbon cycle and natural vegetation, IMAGE framework summary/Earth system