Flowchart Aquatic biodiversity: Difference between revisions
Jump to navigation
Jump to search
No edit summary |
(CSV import) |
||
| Line 1: | Line 1: | ||
{{FigureTemplate | {{FigureTemplate | ||
|Figure= | |Figure=101s img13.png | ||
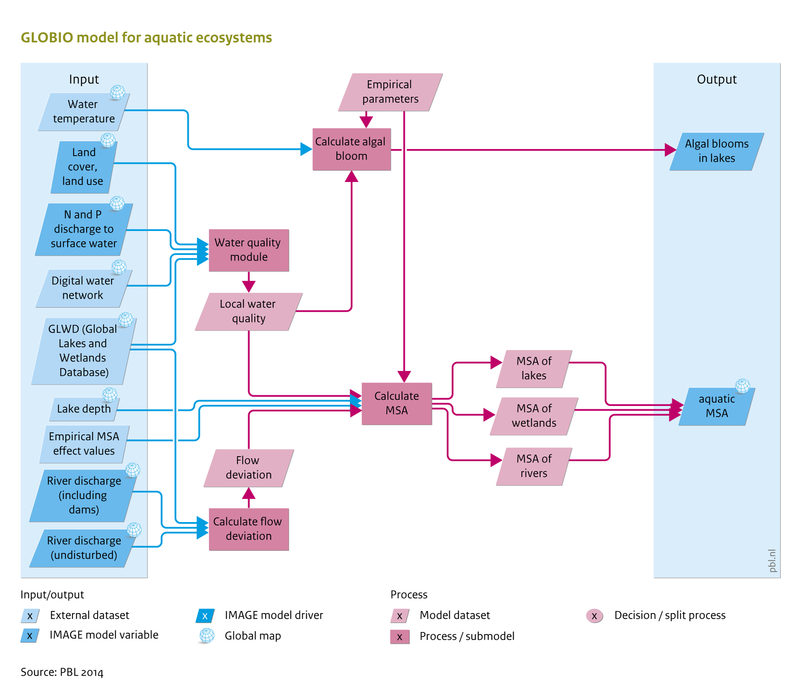
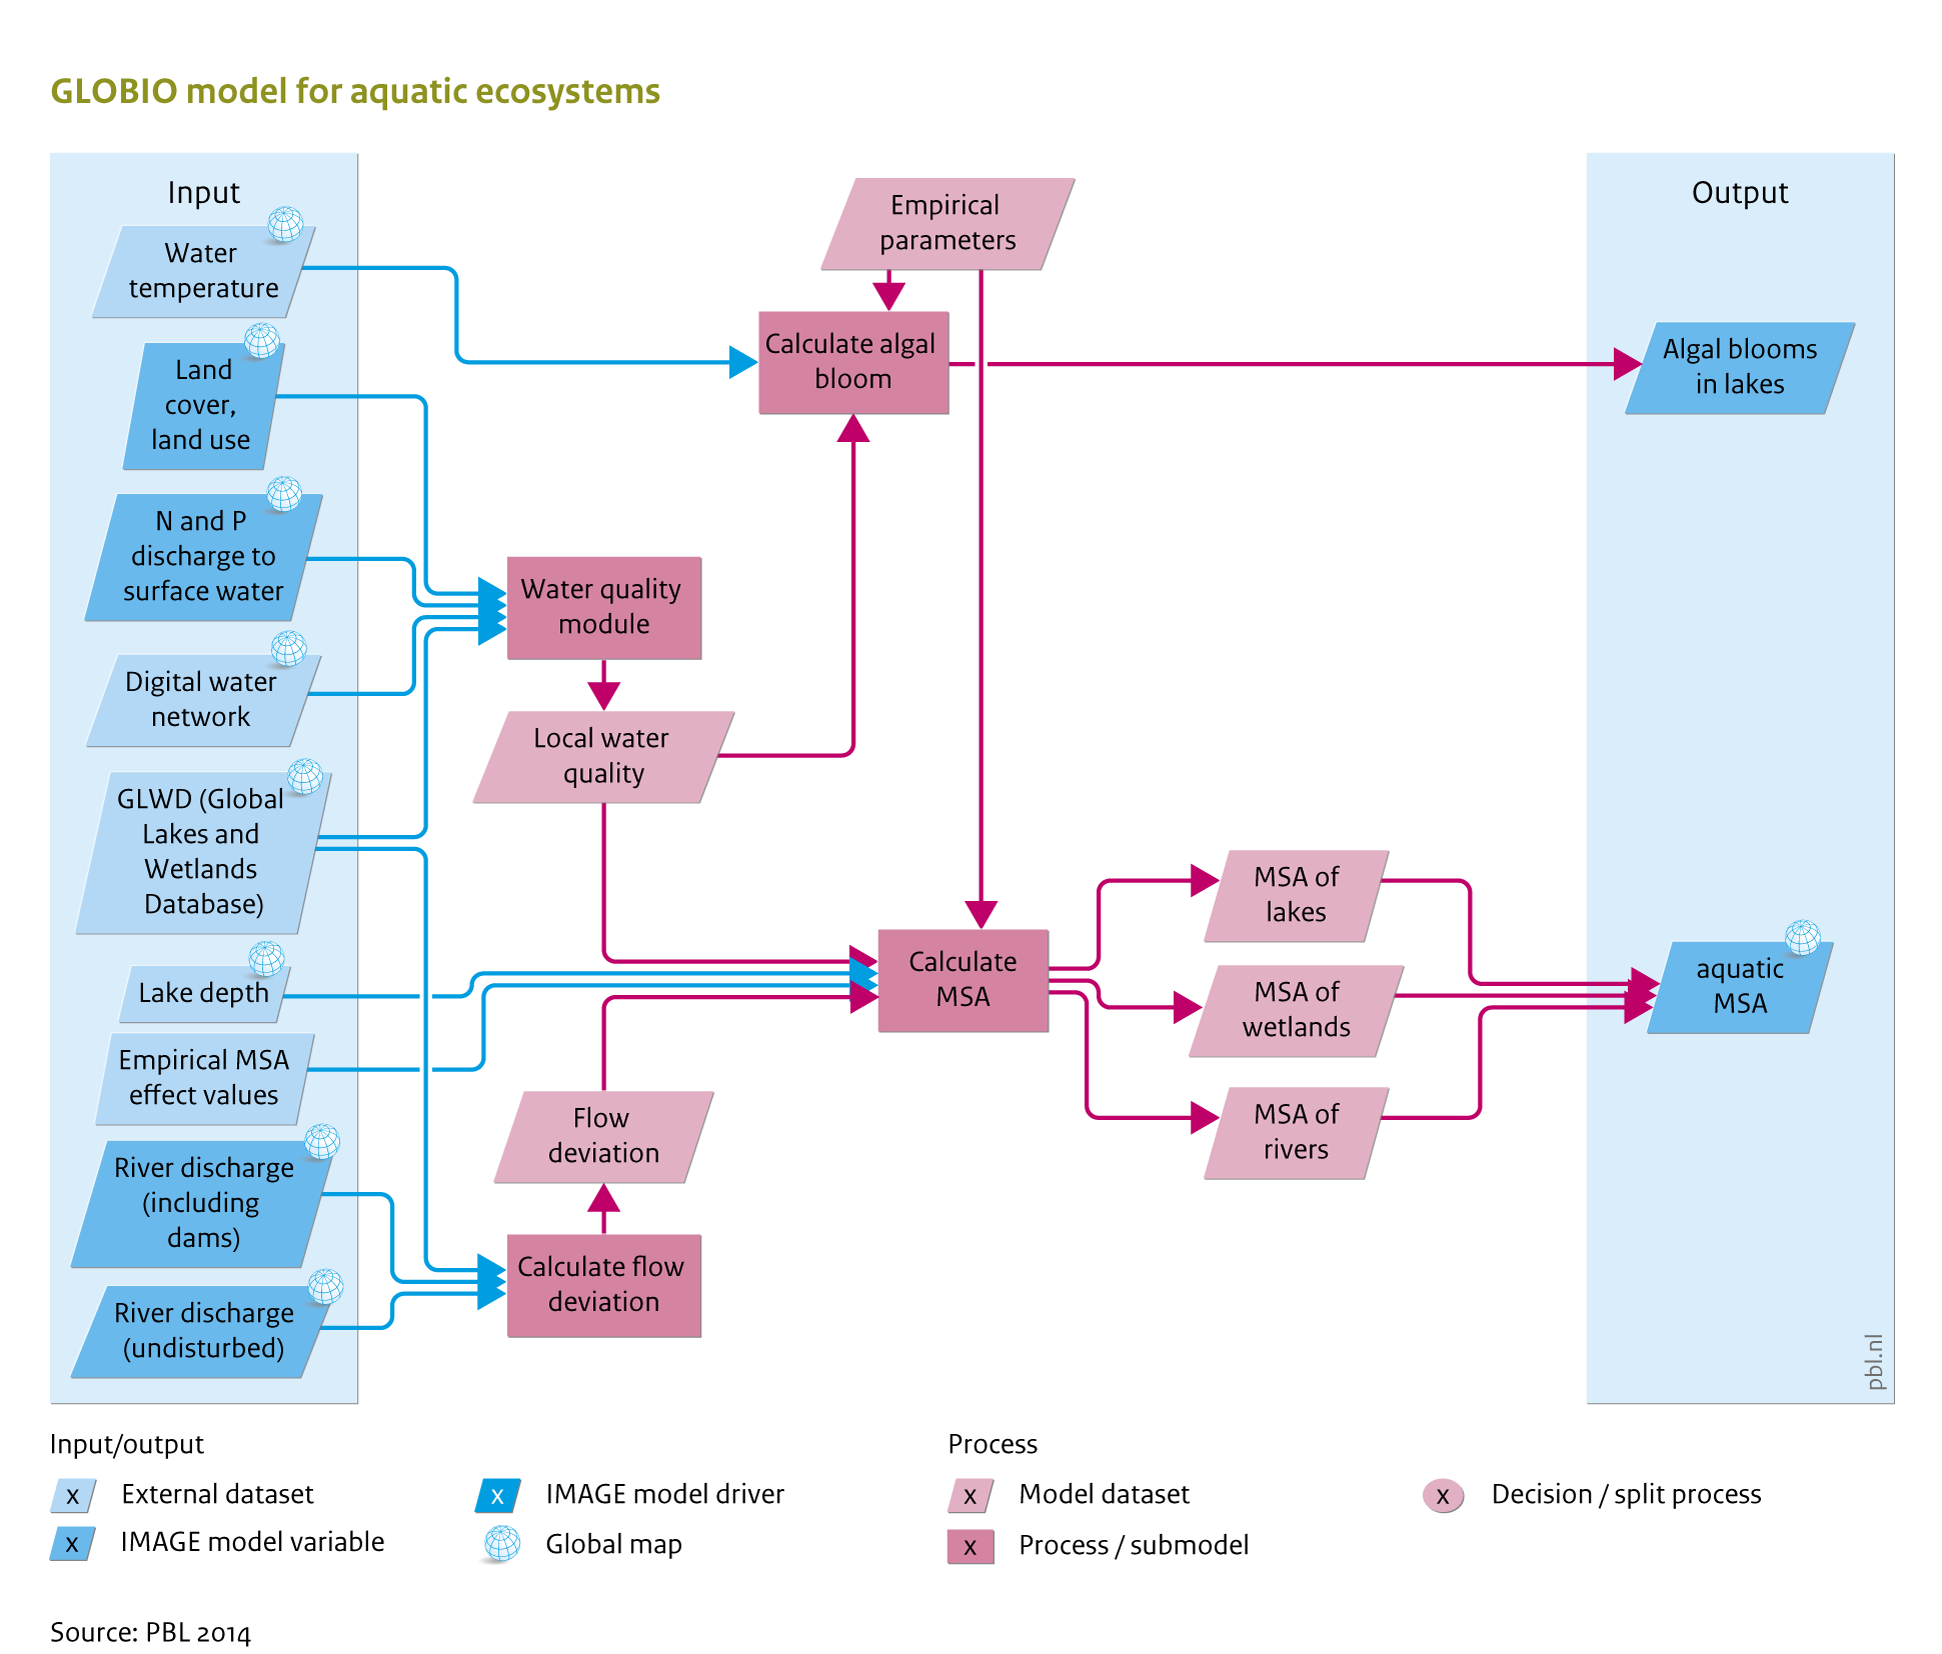
|AltText= | |AltText=GLOBIO model for aquatic ecosystems | ||
|Caption= | |Caption=More detail on inputs and outputs, and how they link to other IMAGE components is presented at Input/Output Table. | ||
|FigureType=Flowchart | |FigureType=Flowchart | ||
|OptimalSize=800 | |OptimalSize=800 | ||
|Component=Aquatic biodiversity; | |Component=Aquatic biodiversity; | ||
}} | }} | ||
Revision as of 14:43, 23 May 2014
Caption: More detail on inputs and outputs, and how they link to other IMAGE components is presented at Input/Output Table.
Figure is used on page(s): Aquatic biodiversity