Baseline figure Energy demand: Difference between revisions
Jump to navigation
Jump to search
No edit summary |
(CSV import) |
||
| Line 1: | Line 1: | ||
{{FigureTemplate | {{FigureTemplate | ||
|Figure=023x img13.png | |Figure=023x img13.png | ||
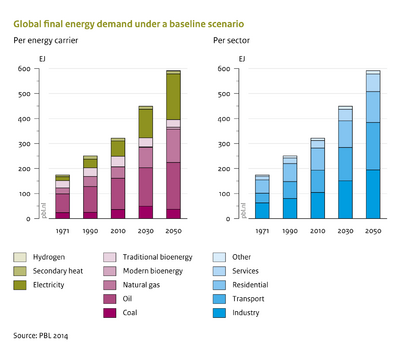
|AltText= | |AltText=Global final energy demand under a baseline scenario | ||
|Caption= | |Caption=Between 2010 and 2050 energy demand for transport and industry, and for natural gas and electricity contribute most to the overall increase. | ||
|FigureType=Baseline figure | |FigureType=Baseline figure | ||
|OptimalSize=400 | |OptimalSize=400 | ||
|Component=Energy demand; | |Component=Energy demand; | ||
}} | }} | ||
Revision as of 14:43, 23 May 2014
Caption: Between 2010 and 2050 energy demand for transport and industry, and for natural gas and electricity contribute most to the overall increase.
Figure is used on page(s): Energy demand