Baseline figure Atmospheric composition and climate: Difference between revisions
Jump to navigation
Jump to search
No edit summary |
(CSV import) |
||
| Line 1: | Line 1: | ||
{{FigureTemplate | {{FigureTemplate | ||
|Figure=091x img13.png | |Figure=091x img13.png | ||
|AltText=Greenhouse gas emissions, CO2 concentration, temperature increase and radiative forcing | |AltText=Greenhouse gas emissions, CO2 concentration, temperature increase and radiative forcing under baseline and climate policy scenarios | ||
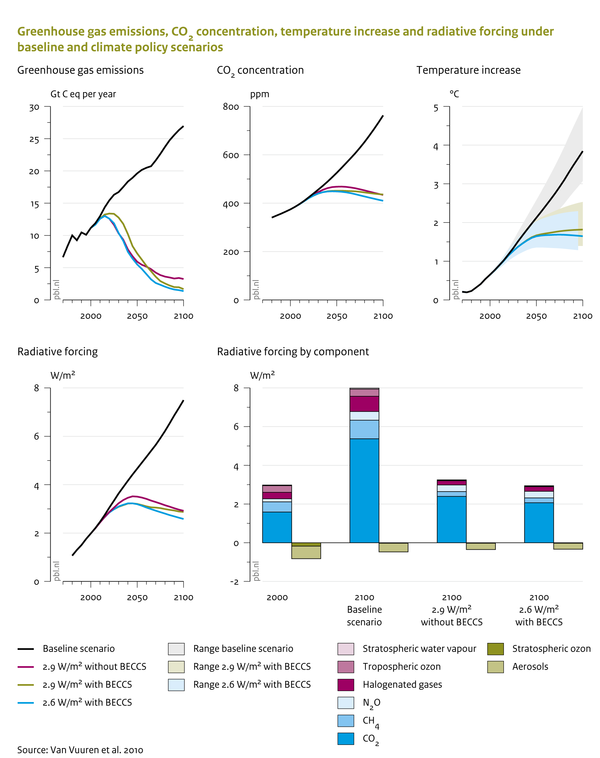
|Caption=In the policy scenarios, emissions decrease strongly after 2020, while concentration levels only decrease or stabilise after 2050. Global mean temperature, due to inertia in the climate system, will not stabilise until the end of this century under the most ambitious climate policy scenario (2.6 W/m2). | |Caption=In the policy scenarios, emissions decrease strongly after 2020, while concentration levels only decrease or stabilise after 2050. Global mean temperature, due to inertia in the climate system, will not stabilise until the end of this century under the most ambitious climate policy scenario (2.6 W/m2). | ||
|FigureType=Baseline figure | |FigureType=Baseline figure | ||
Revision as of 14:43, 23 May 2014
Caption: In the policy scenarios, emissions decrease strongly after 2020, while concentration levels only decrease or stabilise after 2050. Global mean temperature, due to inertia in the climate system, will not stabilise until the end of this century under the most ambitious climate policy scenario (2.6 W/m2).
Figure is used on page(s): Atmospheric composition and climate