Baseline figure Crops and grass: Difference between revisions
Jump to navigation
Jump to search
No edit summary |
(CSV import) |
||
| Line 1: | Line 1: | ||
{{FigureTemplate | {{FigureTemplate | ||
|Figure= | |Figure=078x img13.png | ||
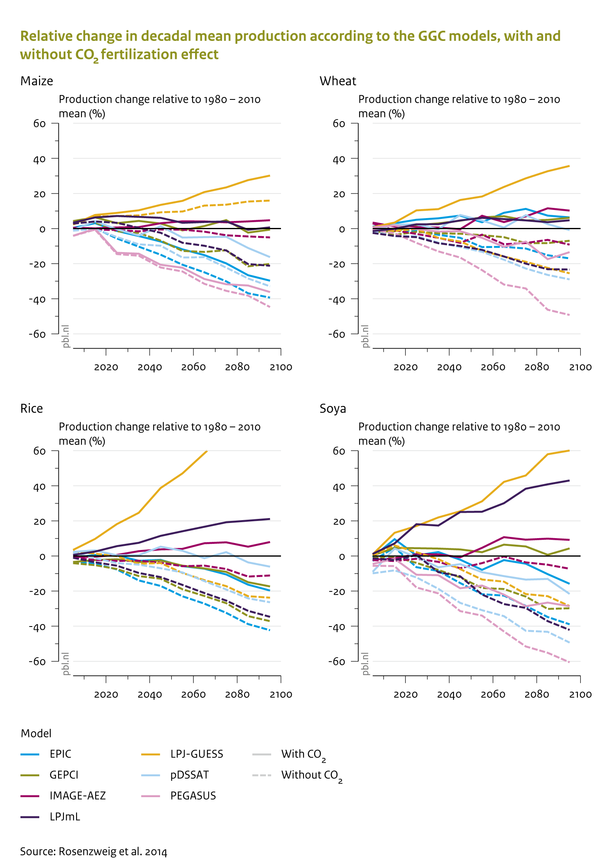
|Caption= | |Caption=The effect of climate change on crop yields strongly depends on the effect of CO2 fertilisation, also represented in LPJmL. Lines show means across several climate scenarios; adopted from Rosenzweig et al. (2014). | ||
|FigureType=Baseline figure | |FigureType=Baseline figure | ||
|OptimalSize=600 | |OptimalSize=600 | ||
|Component=Crops and grass; | |Component=Crops and grass; | ||
|AltText=Relative change in decadal mean production according to the GGC models, with and without CO2 fertilization effect | |||
}} | }} | ||
Revision as of 14:43, 23 May 2014
Caption: The effect of climate change on crop yields strongly depends on the effect of CO2 fertilisation, also represented in LPJmL. Lines show means across several climate scenarios; adopted from Rosenzweig et al. (2014).
Figure is used on page(s): Crops and grass