Flowchart Energy demand: Difference between revisions
Jump to navigation
Jump to search

No edit summary |
(CSV import) |
||
| Line 1: | Line 1: | ||
{{FigureTemplate | {{FigureTemplate | ||
|Figure= | |Figure=022s img13.png | ||
|AltText= | |AltText=TIMER model, energy demand module | ||
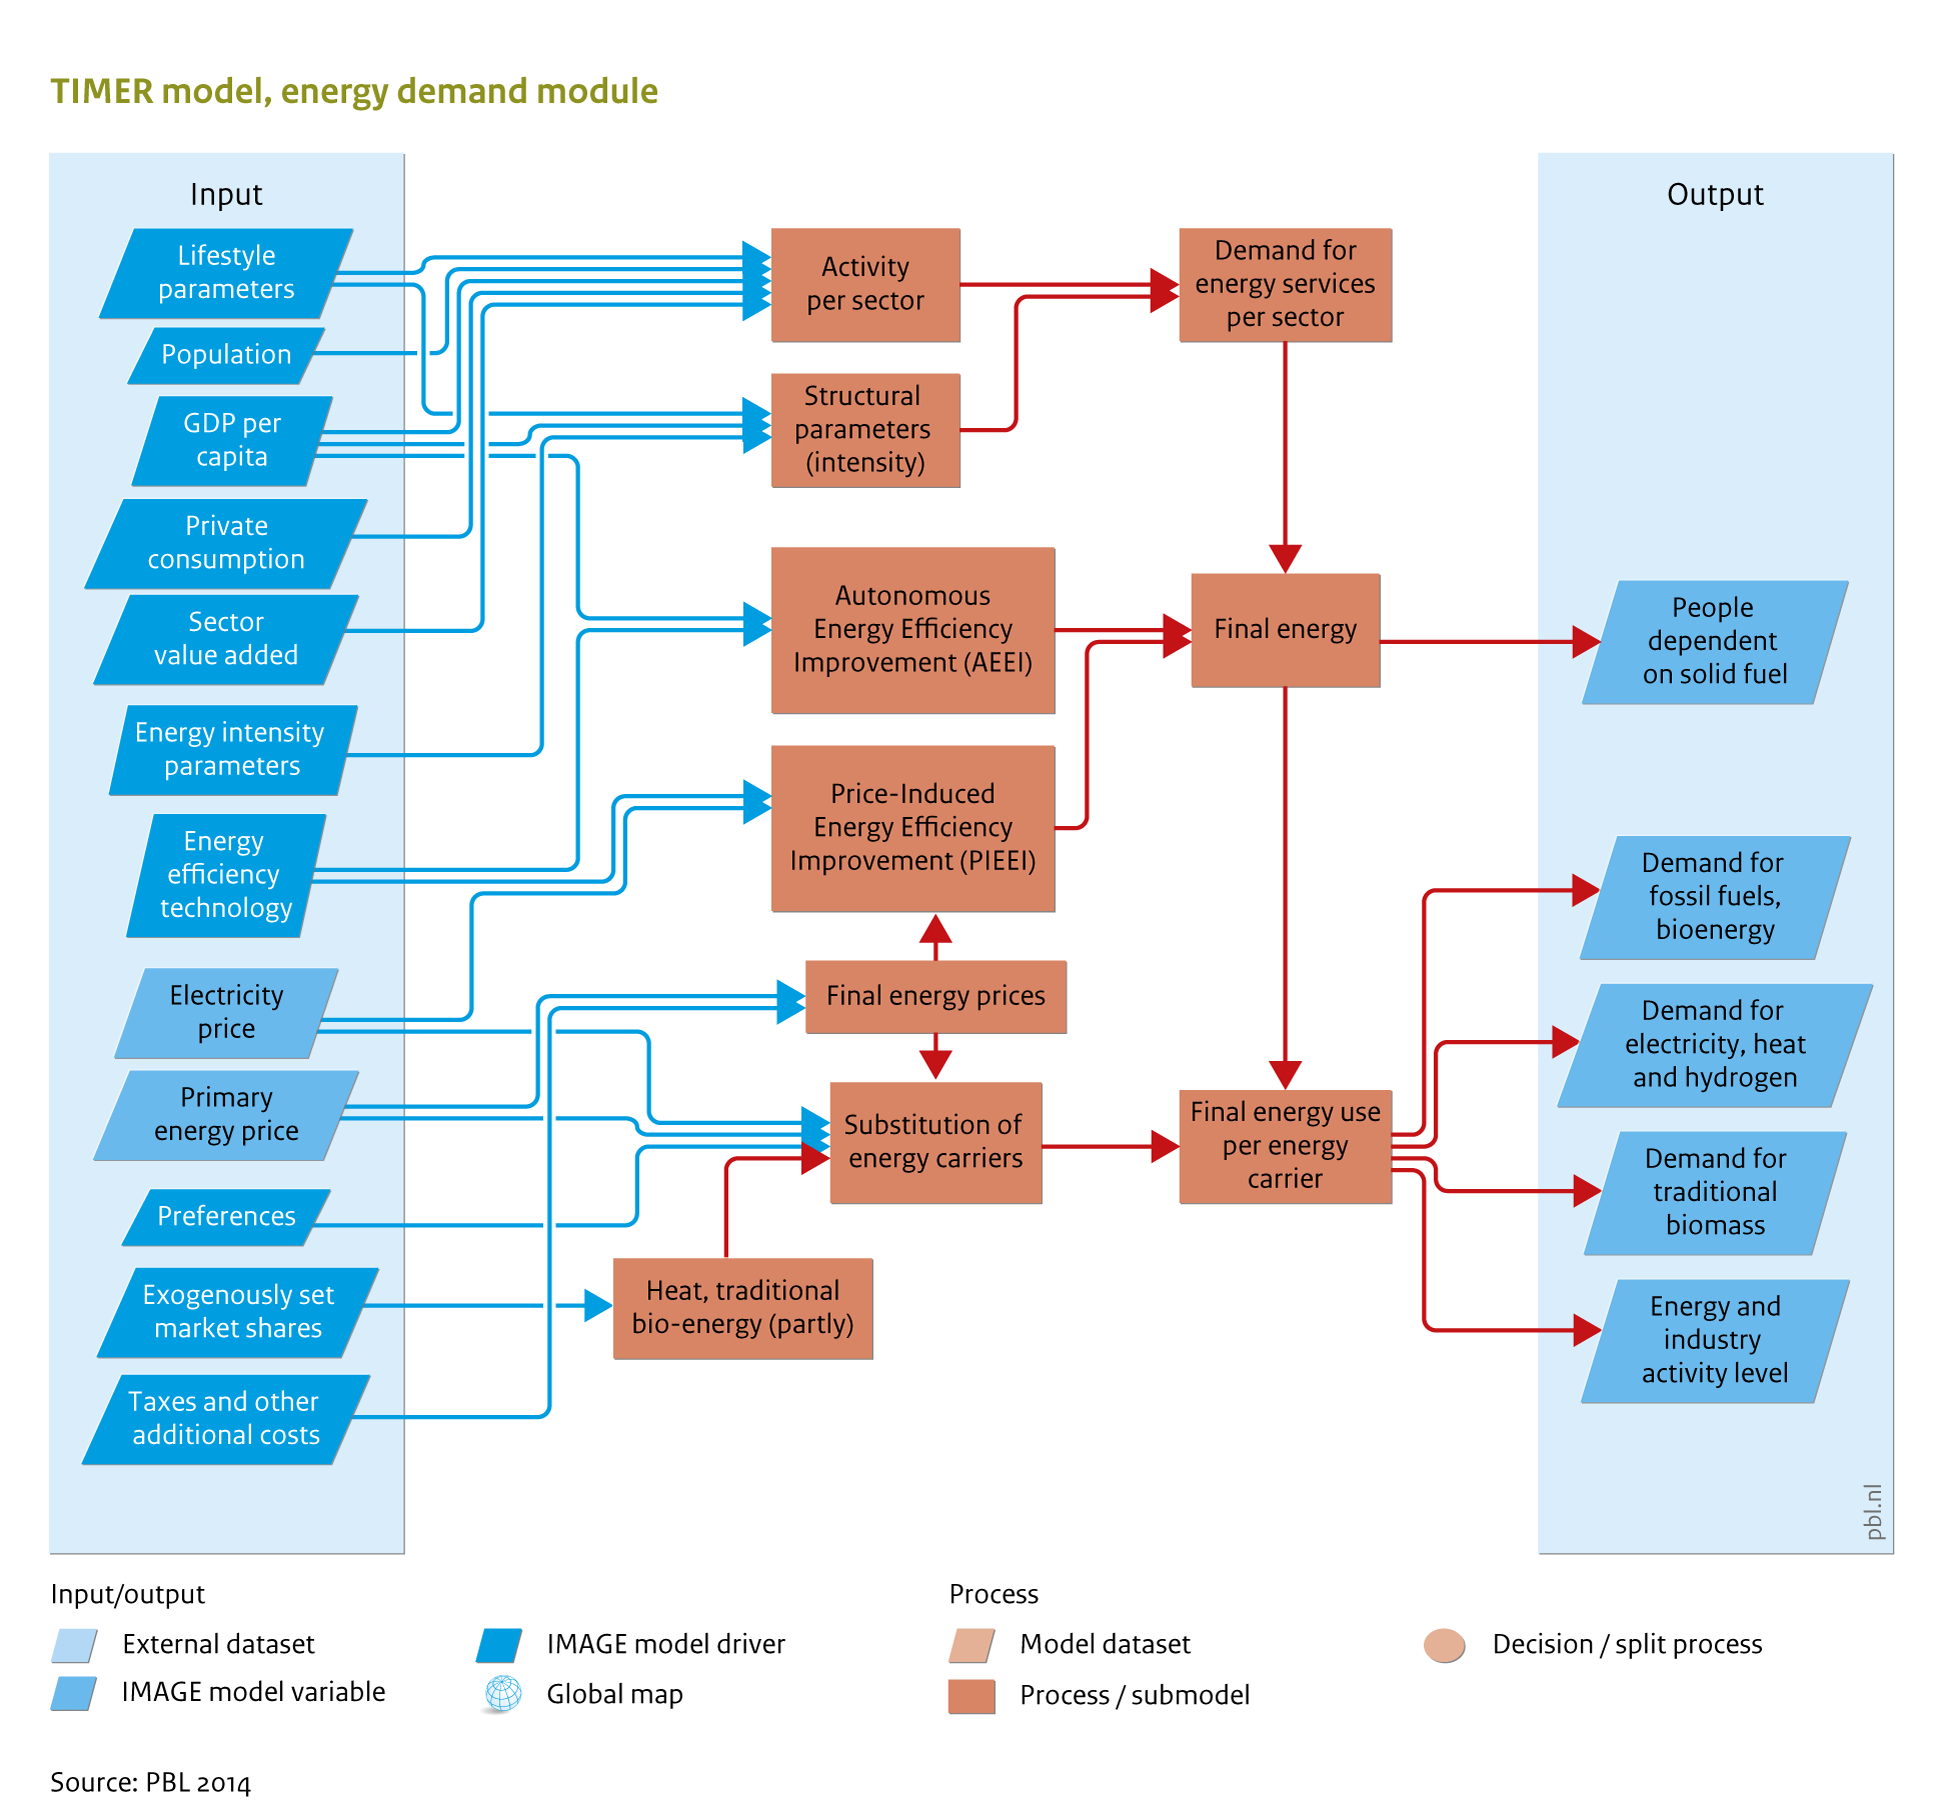
|Caption= | |Caption=Some sectors are represented in a generic way as shown here, the sectors transport, residential and heavy industry are modelled in specific modules. | ||
|FigureType=Flowchart | |FigureType=Flowchart | ||
|OptimalSize=800 | |OptimalSize=800 | ||
|Component=Energy demand; | |Component=Energy demand; | ||
}} | }} | ||
Revision as of 14:43, 23 May 2014
Caption: Some sectors are represented in a generic way as shown here, the sectors transport, residential and heavy industry are modelled in specific modules.
Figure is used on page(s): Energy demand