Policy intervention figure Climate policy: Difference between revisions
Jump to navigation
Jump to search
(CSV import) |
Oostenrijr (talk | contribs) m (Oostenrijr moved page Policy intervention figure CP to Policy intervention figure Climate policy without leaving a redirect: Text replace - "CP" to "Climate policy") |
(No difference)
| |
Revision as of 14:57, 24 June 2014
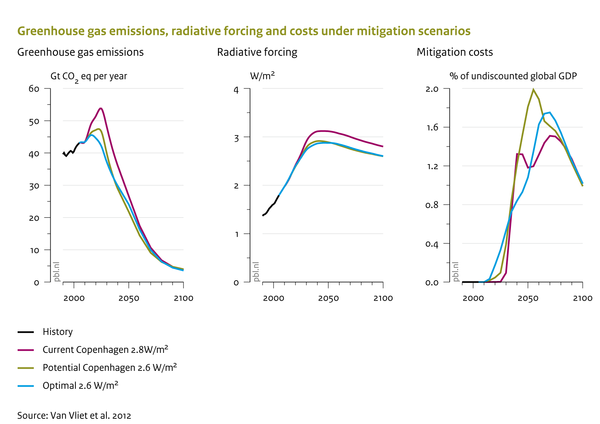
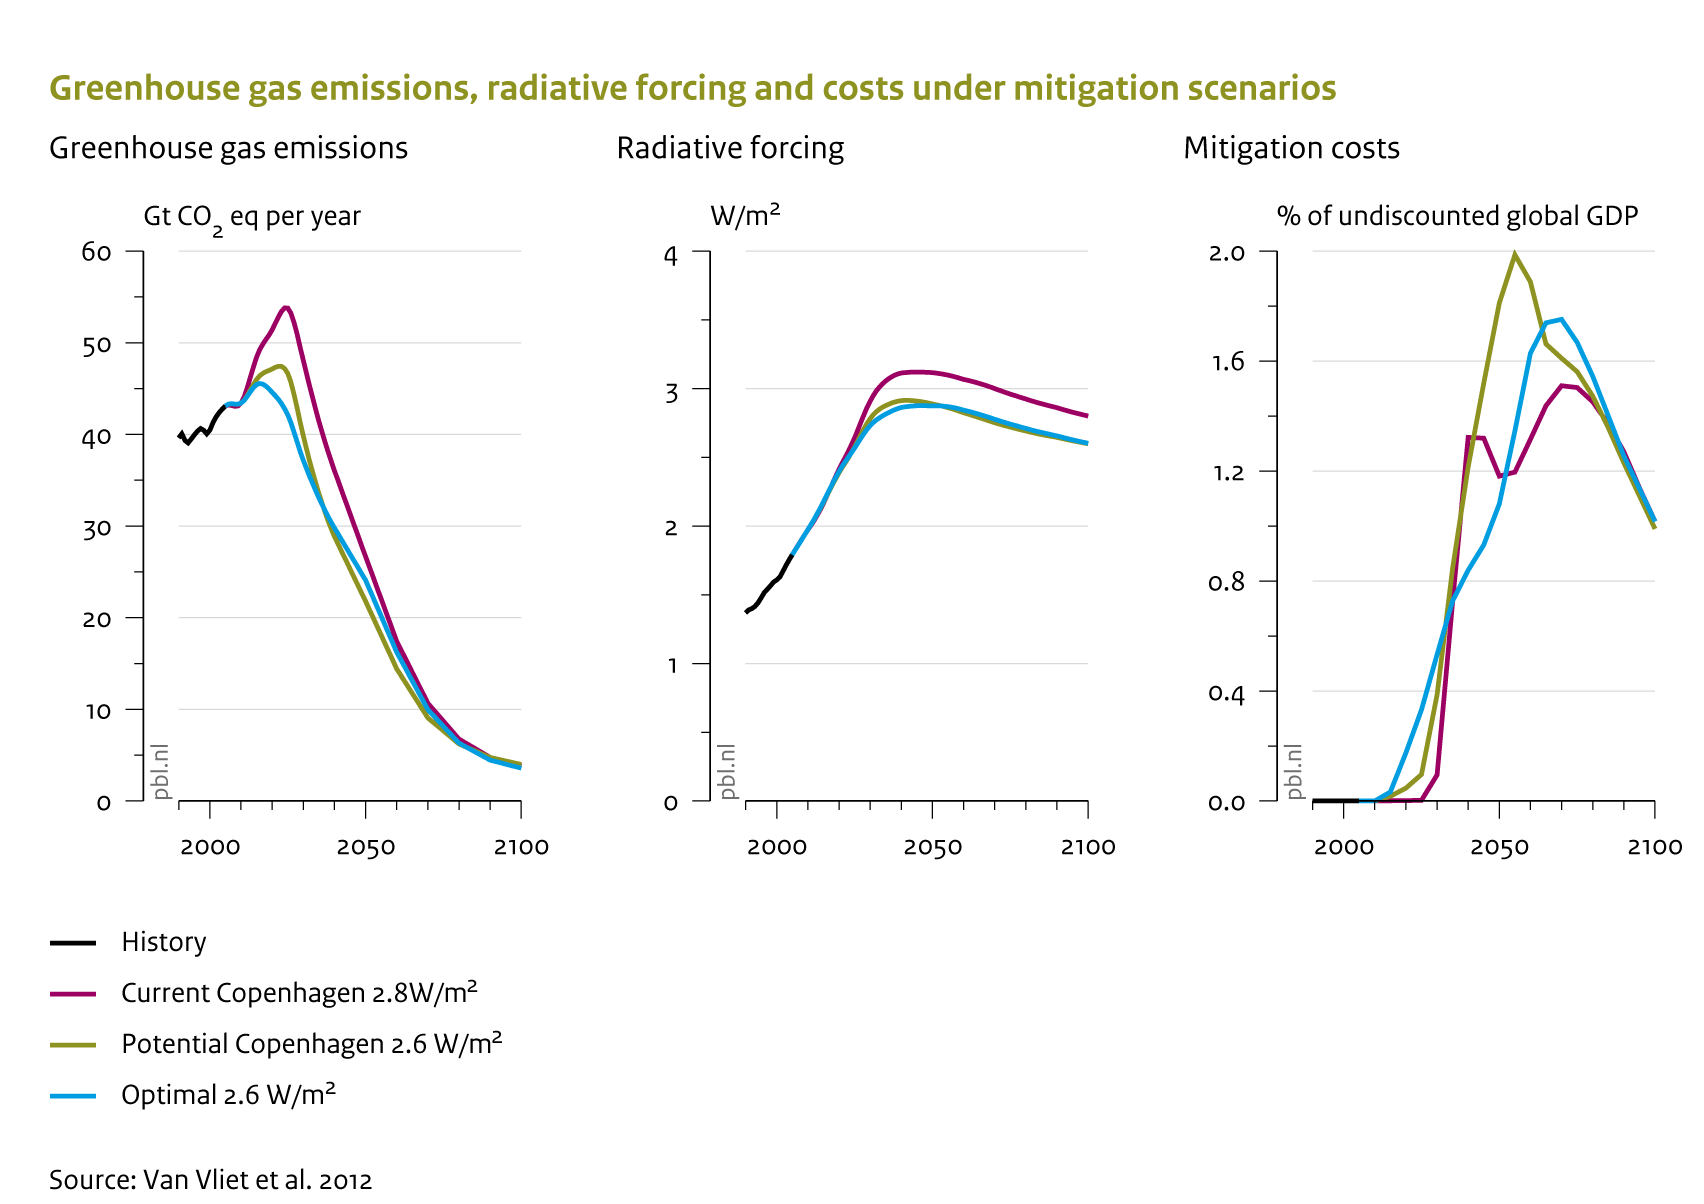
Caption: Scenario results describing emission pathways representing optimal and delayed policy action (Copenhagen pledges) in 2020, in terms of CO2 emission (including land use), associated radiative forcing (including all gases and aerosol forcing), and global mitigation costs (as percentage of GDP).
Figure is used on page(s): Climate policy