Help
File list
Jump to navigation
Jump to search
This special page shows all uploaded files.
File list
Items per page:
20
50
100
250
500
Username:
Include old versions of files
Go
First page
Previous page
Next page
Last page
Date
Name
Thumbnail
Size
User
Description
Versions
18:31, 29 May 2017
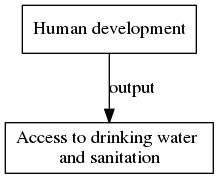
Access to drinking water and sanitation digraph QueryResult dot.png
(
file
)
6 KB
Oostenrijr
generated by the GraphViz
extension
from the
Access to drinking water and sanitation
page
1
18:30, 29 May 2017
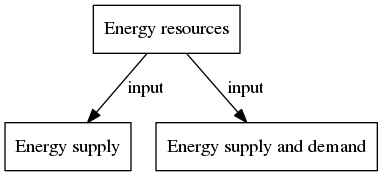
Energy resources digraph QueryResult dot.png
(
file
)
8 KB
Oostenrijr
generated by the GraphViz
extension
from the
Energy resources
page
1
18:30, 29 May 2017
Built up area grid digraph QueryResult dot.png
(
file
)
10 KB
Oostenrijr
generated by the GraphViz
extension
from the
Built-up area - grid
page
1
18:30, 29 May 2017
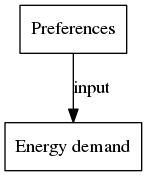
Preferences digraph QueryResult dot.png
(
file
)
4 KB
Oostenrijr
generated by the GraphViz
extension
from the
Preferences
page
1
18:30, 29 May 2017
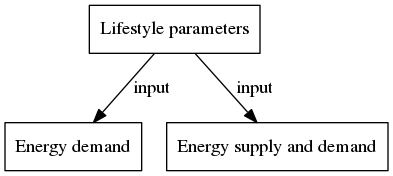
Lifestyle parameters digraph QueryResult dot.png
(
file
)
8 KB
Oostenrijr
generated by the GraphViz
extension
from the
Lifestyle parameters
page
1
18:29, 29 May 2017
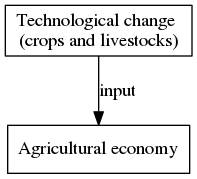
Technological change crops and livestocks digraph QueryResult dot.png
(
file
)
7 KB
Oostenrijr
generated by the GraphViz
extension
from the
Technological change (crops and livestocks)
page
1
18:29, 29 May 2017
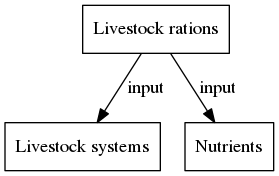
Livestock rations digraph QueryResult dot.png
(
file
)
8 KB
Oostenrijr
generated by the GraphViz
extension
from the
Livestock rations
page
1
18:29, 29 May 2017
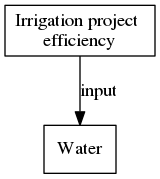
Irrigation project efficiency digraph QueryResult dot.png
(
file
)
5 KB
Oostenrijr
generated by the GraphViz
extension
from the
Irrigation project efficiency
page
1
18:29, 29 May 2017
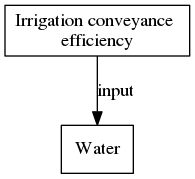
Irrigation conveyance efficiency digraph QueryResult dot.png
(
file
)
5 KB
Oostenrijr
generated by the GraphViz
extension
from the
Irrigation conveyance efficiency
page
1
18:29, 29 May 2017
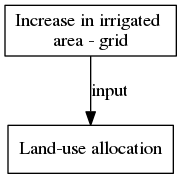
Increase in irrigated area grid digraph QueryResult dot.png
(
file
)
5 KB
Oostenrijr
generated by the GraphViz
extension
from the
Increase in irrigated area - grid
page
1
18:29, 29 May 2017
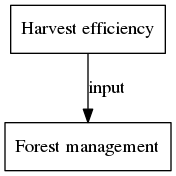
Harvest efficiency digraph QueryResult dot.png
(
file
)
5 KB
Oostenrijr
generated by the GraphViz
extension
from the
Harvest efficiency
page
1
18:29, 29 May 2017
Forest plantation demand digraph QueryResult dot.png
(
file
)
6 KB
Oostenrijr
generated by the GraphViz
extension
from the
Forest plantation demand
page
1
18:29, 29 May 2017
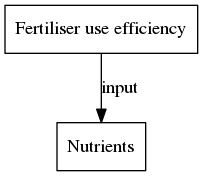
Fertiliser use efficiency digraph QueryResult dot.png
(
file
)
4 KB
Oostenrijr
generated by the GraphViz
extension
from the
Fertiliser use efficiency
page
1
18:29, 29 May 2017
Feed conversion digraph QueryResult dot.png
(
file
)
5 KB
Oostenrijr
generated by the GraphViz
extension
from the
Feed conversion
page
1
18:29, 29 May 2017
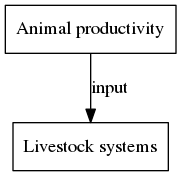
Animal productivity digraph QueryResult dot.png
(
file
)
5 KB
Oostenrijr
generated by the GraphViz
extension
from the
Animal productivity
page
1
18:15, 29 May 2017
Technology development of energy supply digraph QueryResult dot.png
(
file
)
10 KB
Oostenrijr
generated by the GraphViz
extension
from the
Technology development of energy supply
page
1
18:15, 29 May 2017
Technology development of energy conversion digraph QueryResult dot.png
(
file
)
10 KB
Oostenrijr
generated by the GraphViz
extension
from the
Technology development of energy conversion
page
1
18:15, 29 May 2017
Learning rate digraph QueryResult dot.png
(
file
)
4 KB
Oostenrijr
generated by the GraphViz
extension
from the
Learning rate
page
1
18:15, 29 May 2017
Energy intensity parameters digraph QueryResult dot.png
(
file
)
5 KB
Oostenrijr
generated by the GraphViz
extension
from the
Energy intensity parameters
page
1
18:15, 29 May 2017
Energy efficiency technology digraph QueryResult dot.png
(
file
)
5 KB
Oostenrijr
generated by the GraphViz
extension
from the
Energy efficiency technology
page
1
18:14, 29 May 2017
Energy policy digraph QueryResult dot.png
(
file
)
5 KB
Oostenrijr
generated by the GraphViz
extension
from the
Energy policy
page
1
18:14, 29 May 2017
Domestic climate policy digraph QueryResult dot.png
(
file
)
5 KB
Oostenrijr
generated by the GraphViz
extension
from the
Domestic climate policy
page
1
18:14, 29 May 2017
Climate target digraph QueryResult dot.png
(
file
)
4 KB
Oostenrijr
generated by the GraphViz
extension
from the
Climate target
page
1
18:02, 29 May 2017
Biofuel policy digraph QueryResult dot.png
(
file
)
5 KB
Oostenrijr
generated by the GraphViz
extension
from the
Biofuel policy
page
1
17:44, 29 May 2017
Air pollution policy digraph QueryResult dot.png
(
file
)
5 KB
Oostenrijr
generated by the GraphViz
extension
from the
Air pollution policy
page
1
17:43, 29 May 2017
Equity principles digraph QueryResult dot.png
(
file
)
5 KB
Oostenrijr
generated by the GraphViz
extension
from the
Equity principles
page
1
17:43, 29 May 2017
Protected area grid digraph QueryResult dot.png
(
file
)
15 KB
Oostenrijr
generated by the GraphViz
extension
from the
Protected area - grid
page
1
17:43, 29 May 2017
Taxes and other additional costs digraph QueryResult dot.png
(
file
)
8 KB
Oostenrijr
generated by the GraphViz
extension
from the
Taxes and other additional costs
page
1
16:57, 29 May 2017
Trade restriction digraph QueryResult dot.png
(
file
)
5 KB
Oostenrijr
generated by the GraphViz
extension
from the
Trade restriction
page
1
16:57, 29 May 2017
Trade policy digraph QueryResult dot.png
(
file
)
5 KB
Oostenrijr
generated by the GraphViz
extension
from the
Trade policy
page
1
16:57, 29 May 2017
Timber demand digraph QueryResult dot.png
(
file
)
5 KB
Oostenrijr
generated by the GraphViz
extension
from the
Timber demand
page
1
16:57, 29 May 2017
Sector value added digraph QueryResult dot.png
(
file
)
8 KB
Oostenrijr
generated by the GraphViz
extension
from the
Sector value added
page
1
16:56, 29 May 2017
Private consumption digraph QueryResult dot.png
(
file
)
9 KB
Oostenrijr
generated by the GraphViz
extension
from the
Private consumption
page
1
16:56, 29 May 2017
Labour supply digraph QueryResult dot.png
(
file
)
5 KB
Oostenrijr
generated by the GraphViz
extension
from the
Labour supply
page
1
16:56, 29 May 2017
GINI coefficient digraph QueryResult dot.png
(
file
)
5 KB
Oostenrijr
generated by the GraphViz
extension
from the
GINI coefficient
page
1
16:55, 29 May 2017
GDP per capita grid digraph QueryResult dot.png
(
file
)
10 KB
Oostenrijr
generated by the GraphViz
extension
from the
GDP per capita - grid
page
1
16:55, 29 May 2017
GDP per capita digraph QueryResult dot.png
(
file
)
16 KB
Oostenrijr
generated by the GraphViz
extension
from the
GDP per capita
page
1
16:55, 29 May 2017
Capital supply digraph QueryResult dot.png
(
file
)
5 KB
Oostenrijr
generated by the GraphViz
extension
from the
Capital supply
page
1
16:55, 29 May 2017
Urban population fraction digraph QueryResult dot.png
(
file
)
5 KB
Oostenrijr
generated by the GraphViz
extension
from the
Urban population fraction
page
1
16:54, 29 May 2017
Population grid digraph QueryResult dot.png
(
file
)
13 KB
Oostenrijr
generated by the GraphViz
extension
from the
Population - grid
page
1
16:54, 29 May 2017
Algal blooms in lakes digraph QueryResult dot.png
(
file
)
6 KB
Oostenrijr
generated by the GraphViz
extension
from the
Algal blooms in lakes
page
1
16:42, 29 May 2017
Aquatic MSA grid digraph QueryResult dot.png
(
file
)
6 KB
Oostenrijr
generated by the GraphViz
extension
from the
Aquatic MSA - grid
page
1
16:38, 29 May 2017
Demand all commodities digraph QueryResult dot.png
(
file
)
6 KB
Oostenrijr
generated by the GraphViz
extension
from the
Demand (all commodities)
page
1
16:26, 29 May 2017
Population digraph QueryResult dot.png
(
file
)
13 KB
Oostenrijr
generated by the GraphViz
extension
from the
Population
page
1
16:25, 29 May 2017
Ecosystem services effect values digraph QueryResult dot.png
(
file
)
7 KB
Oostenrijr
generated by the GraphViz
extension
from the
Ecosystem services effect values
page
1
17:52, 1 May 2017
Dataflow overview state components digraph QueryResult dot.png
(
file
)
364 KB
Oostenrijr
generated by the GraphViz
extension
from the
Dataflow overview - state components
page
1
17:52, 1 May 2017
Dataflow overview all components digraph QueryResult dot.png
(
file
)
991 KB
Oostenrijr
generated by the GraphViz
extension
from the
Dataflow overview - all components
page
1
17:52, 1 May 2017
Dataflow overview impact components digraph QueryResult dot.png
(
file
)
310 KB
Oostenrijr
generated by the GraphViz
extension
from the
Dataflow overview - impact components
page
1
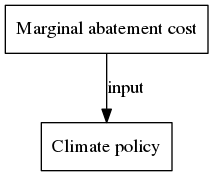
16:16, 21 April 2017
Marginal abatement cost digraph QueryResult dot.png
(
file
)
6 KB
generated by the GraphViz
extension
from the
Marginal abatement cost
page
1
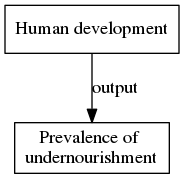
14:59, 21 April 2017
Prevalence of undernourishment digraph QueryResult dot.png
(
file
)
6 KB
generated by the GraphViz
extension
from the
Prevalence of undernourishment
page
1
First page
Previous page
Next page
Last page
Navigation menu
Personal tools
Log in
Namespaces
Special page
English
Views
More
Search
Home IMAGE
Home IMAGE
IMAGE framework
Framework introduction
Framework summary
Model components
Applications
Publications
Big Flowchart
Versions
Navigation
Via key policy issues
Via policy interventions
Via components
Via variables
Via graphical dataflow
Via references
All overviews
Browse wiki
Browse categories
All overviews
Glossary
IMAGE-model data
Download overview
Download packages
USS manual
About
Colophon
Contact
Site changes
Tools
Special pages
Printable version


