Policy intervention figure Aquatic biodiversity
Jump to navigation
Jump to search

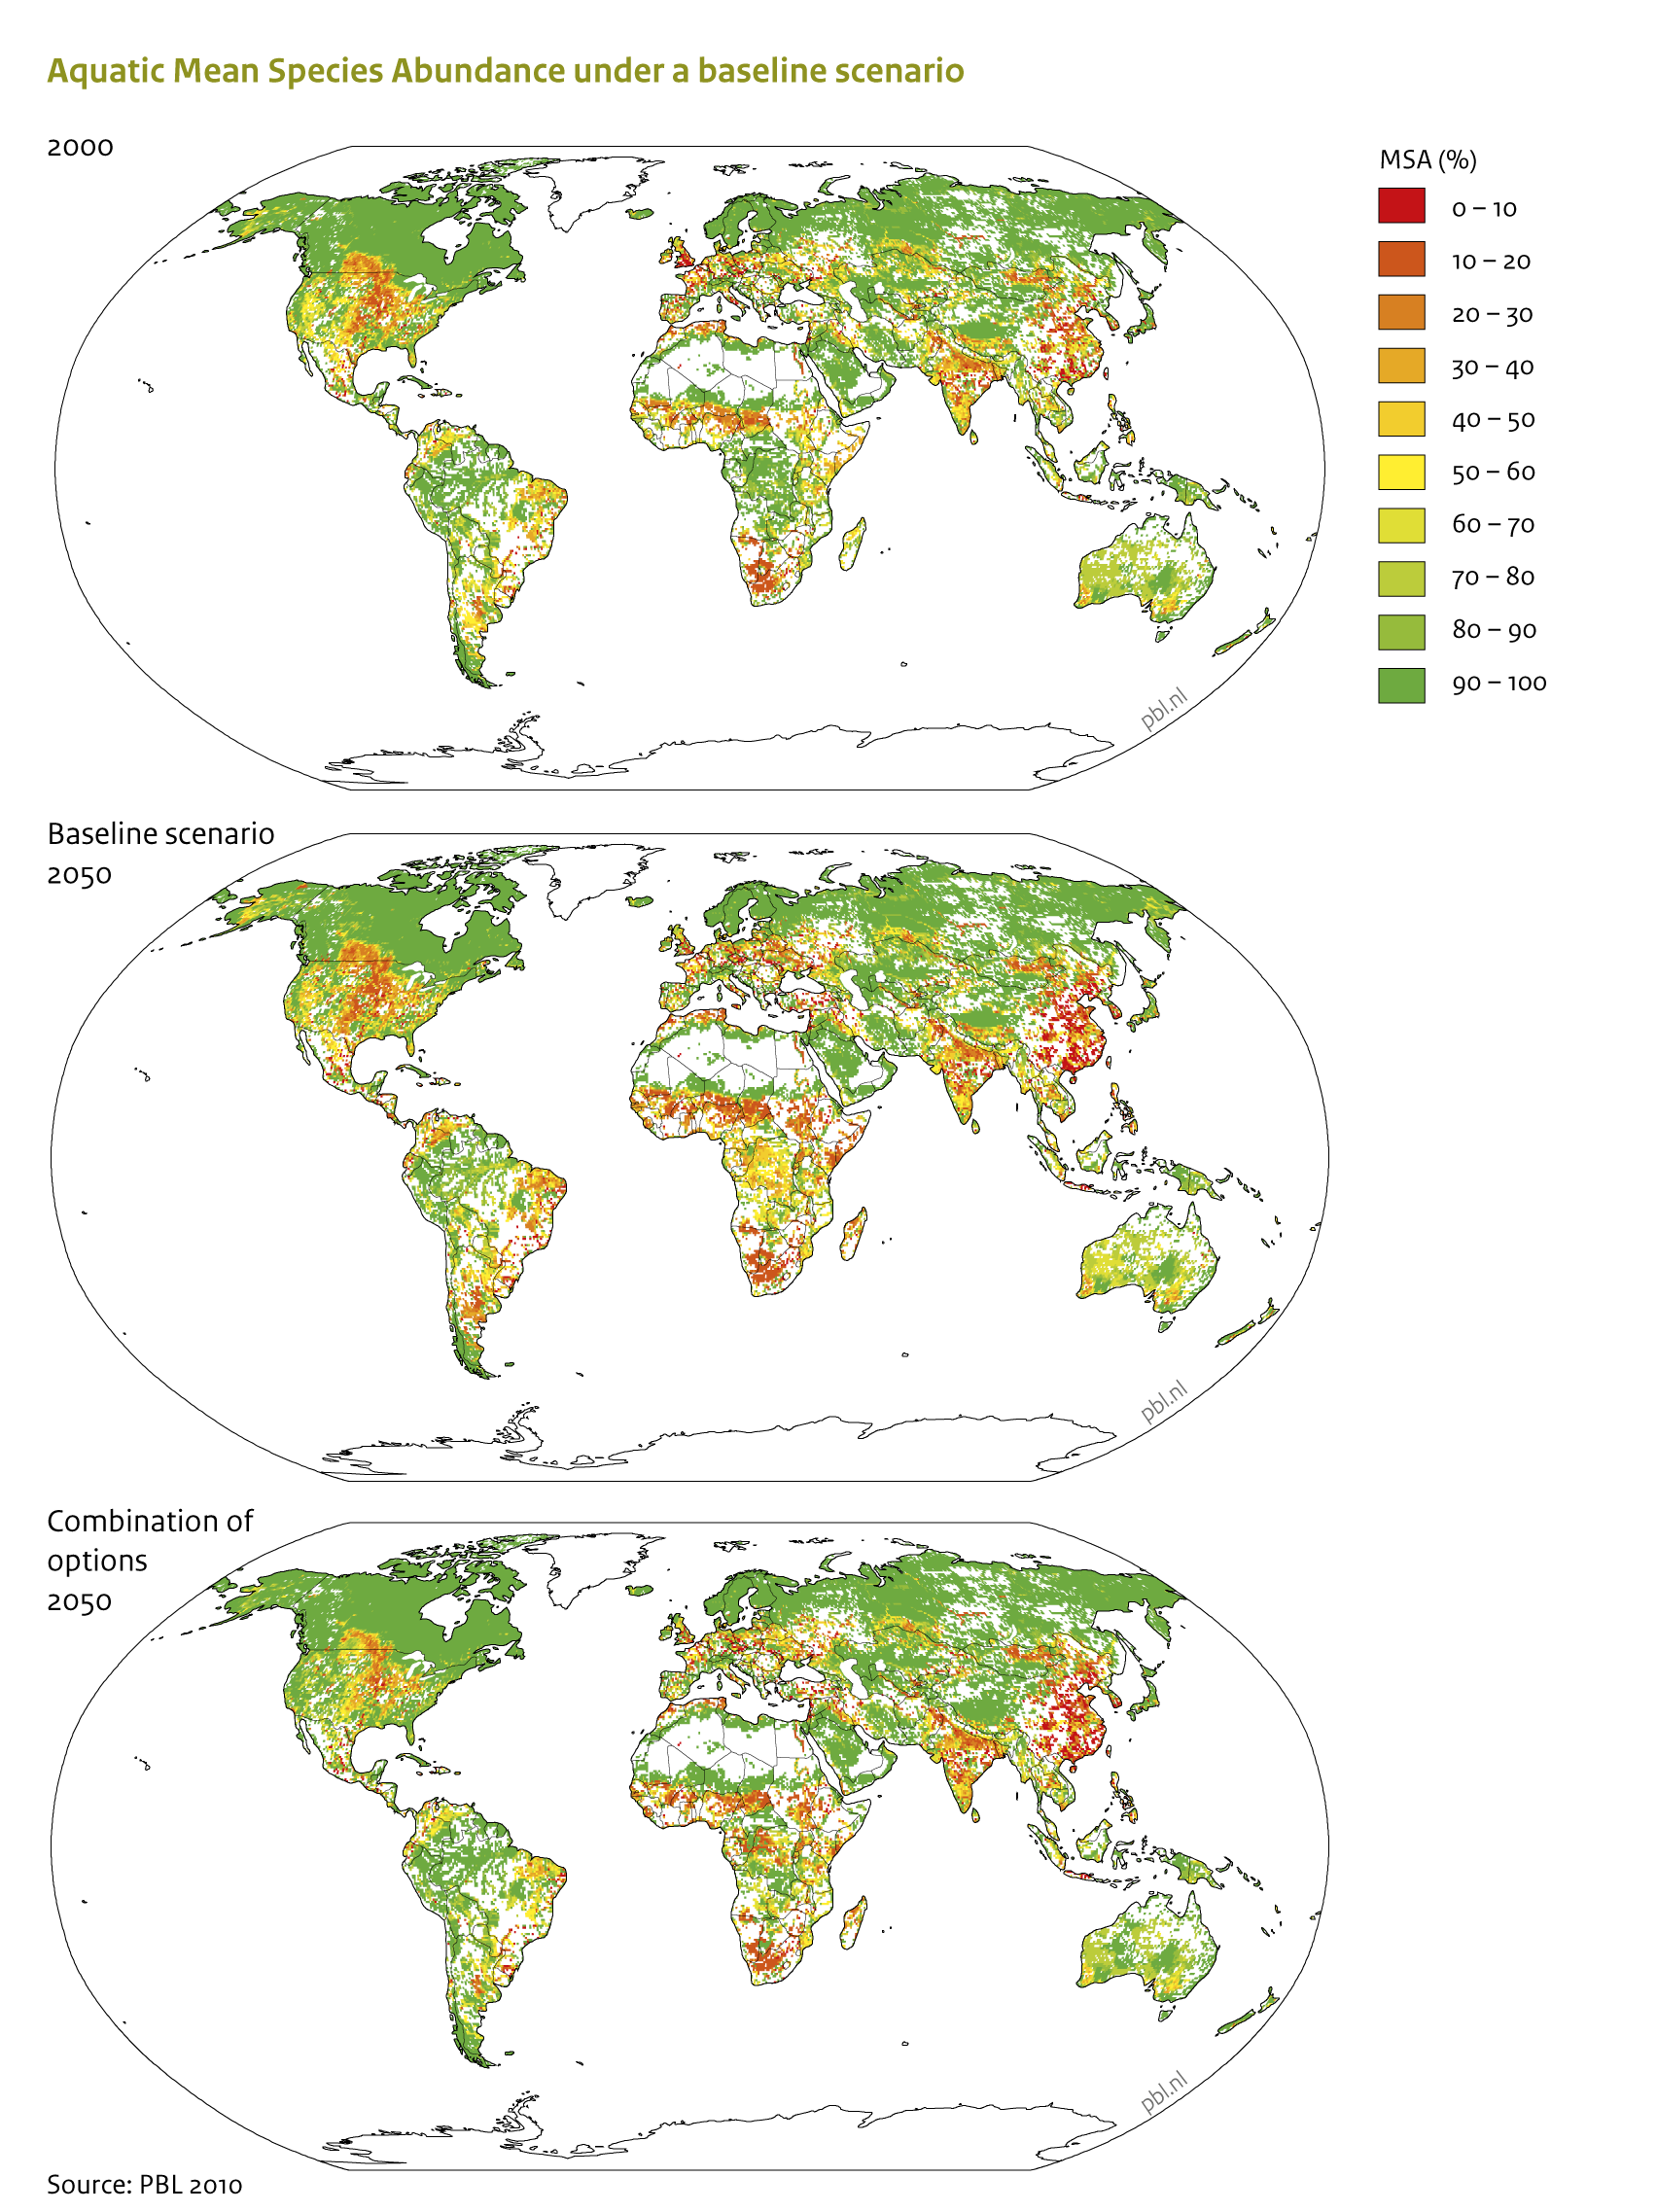
Caption: Map of the mean freshwater MSA for 2000 and 2050 (OECD baseline scenario) (PBL, 2010).
Figure is used on page(s): Aquatic biodiversity
Caption: Map of the mean freshwater MSA for 2000 and 2050 (OECD baseline scenario) (PBL, 2010).
Figure is used on page(s): Aquatic biodiversity