File:Dataflow overview interaction components digraph interaction components dot.png
Jump to navigation
Jump to search
Size of this preview: 250 × 599 pixels. Other resolution: 401 × 960 pixels.
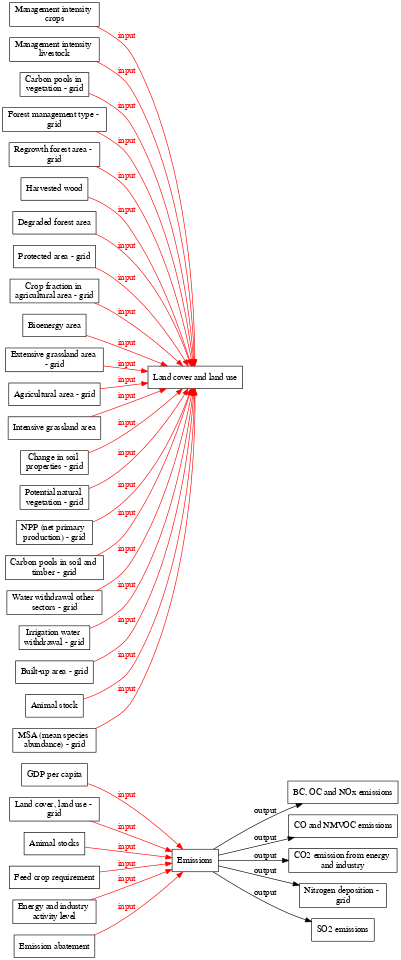
Original file (401 × 960 pixels, file size: 81 KB, MIME type: image/png)
ImageMap
When including this image in a wiki page, use the following mark-up to enable links:
<imagemap>
File:Dataflow_overview___interaction_components_digraph_interaction_components_dot.png
rect 1077 683 1307 731 [[BC  OC and NOx emissions]]
rect 883 865 981 913 [[Emissions]]
rect 1078 755 1306 803 [[CO and NMVOC emissions]]
rect 1079 827 1305 877 [[CO2 emission from energy and industry]]
rect 1101 901 1283 952 [[Nitrogen deposition - grid]]
rect 1083 977 1301 1047 [[Non-CO2 GHG emissions (CH4  N2O and Halocarbons)]]
rect 1127 1072 1257 1120 [[SO2 emissions]]
rect 638 567 765 615 [[Animal stocks]]
rect 616 639 787 687 [[Emission abatement]]
rect 606 711 797 761 [[Land cover  land use - grid]]
rect 614 932 789 983 [[Energy and industry activity level]]
rect 608 1007 795 1055 [[Feed crop requirement]]
rect 634 1079 769 1127 [[GDP per capita]]
rect 309 785 509 833 [[Land cover and land use]]
rect 645 785 757 833 [[Land supply]]
rect 630 857 773 908 [[Land supply for bioenergy - grid]]
rect 41 5 188 56 [[Potential natural vegetation - grid]]
rect 22 80 207 131 [[Crop fraction in agricultural area - grid]]
rect 49 155 181 203 [[Bioenergy area]]
rect 11 227 218 277 [[Extensive grassland area - grid]]
rect 17 301 213 349 [[Intensive grassland area]]
rect 19 373 210 424 [[Management intensity crops]]
rect 19 448 210 499 [[Management intensity livestock]]
rect 41 523 189 573 [[Irrigation water withdrawal - grid]]
rect 15 597 215 648 [[Water withdrawal other sectors - grid]]
rect 5 672 224 723 [[Forest management type - grid]]
rect 45 747 184 797 [[Change in soil properties - grid]]
rect 12 821 217 872 [[Carbon pools in soil and timber - grid]]
rect 43 896 186 947 [[Carbon pools in vegetation - grid]]
rect 37 971 193 1021 [[NPP (net primary production) - grid]]
rect 27 1045 202 1096 [[MSA (mean species abundance) - grid]]
rect 19 1120 210 1171 [[Regrowth forest area - grid]]
rect 19 1195 210 1243 [[Agricultural area - grid]]
rect 29 1267 200 1315 [[Protected area - grid]]
rect 28 1339 201 1387 [[Degraded forest area]]
rect 45 1411 185 1459 [[Harvested wood]]
rect 55 1483 175 1531 [[Animal stock]]
rect 33 1555 196 1603 [[Built-up area - grid]]</imagemap>
See ImageMap for more information.
File history
Click on a date/time to view the file as it appeared at that time.
| Date/Time | Thumbnail | Dimensions | User | Comment | |
|---|---|---|---|---|---|
| current | 11:08, 23 March 2020 | | 401 × 960 (81 KB) | Oostenrijr (talk | contribs) | |
| 14:47, 12 March 2020 |  | 793 × 960 (120 KB) | Oostenrijr (talk | contribs) | ||
| 14:58, 10 March 2020 |  | 793 × 960 (121 KB) | Oostenrijr (talk | contribs) | ||
| 10:46, 19 July 2017 | 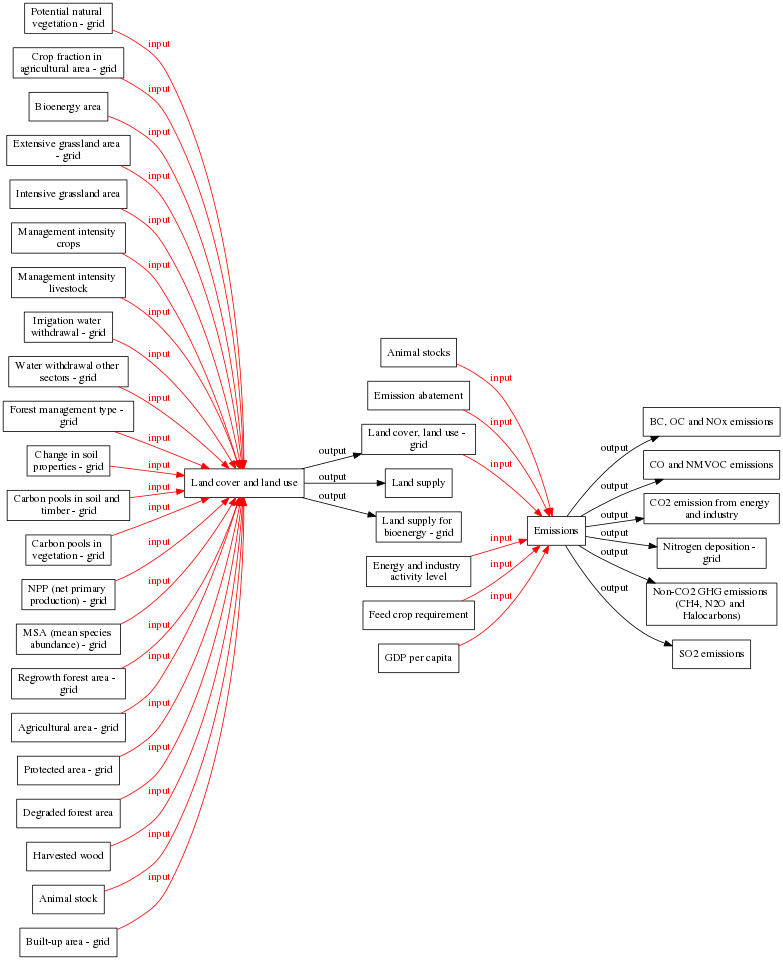 | 783 × 960 (117 KB) | Oostenrijr (talk | contribs) | generated by the GraphViz extension from the Dataflow overview - interaction components page | |
| 10:39, 19 July 2017 |  | 1,312 × 1,608 (236 KB) | Oostenrijr (talk | contribs) | generated by the GraphViz extension from the Dataflow overview - interaction components page | |
| 10:35, 19 July 2017 |  | 1,312 × 1,608 (236 KB) | Oostenrijr (talk | contribs) | generated by the GraphViz extension from the Dataflow overview - interaction components page |
You cannot overwrite this file.
File usage
The following page uses this file: