Baseline figure Aquatic biodiversity: Difference between revisions
Jump to navigation
Jump to search

No edit summary |
(CSV import) |
||
| Line 1: | Line 1: | ||
{{FigureTemplate | {{FigureTemplate | ||
|Figure=102x img13.png | |Figure=102x img13.png | ||
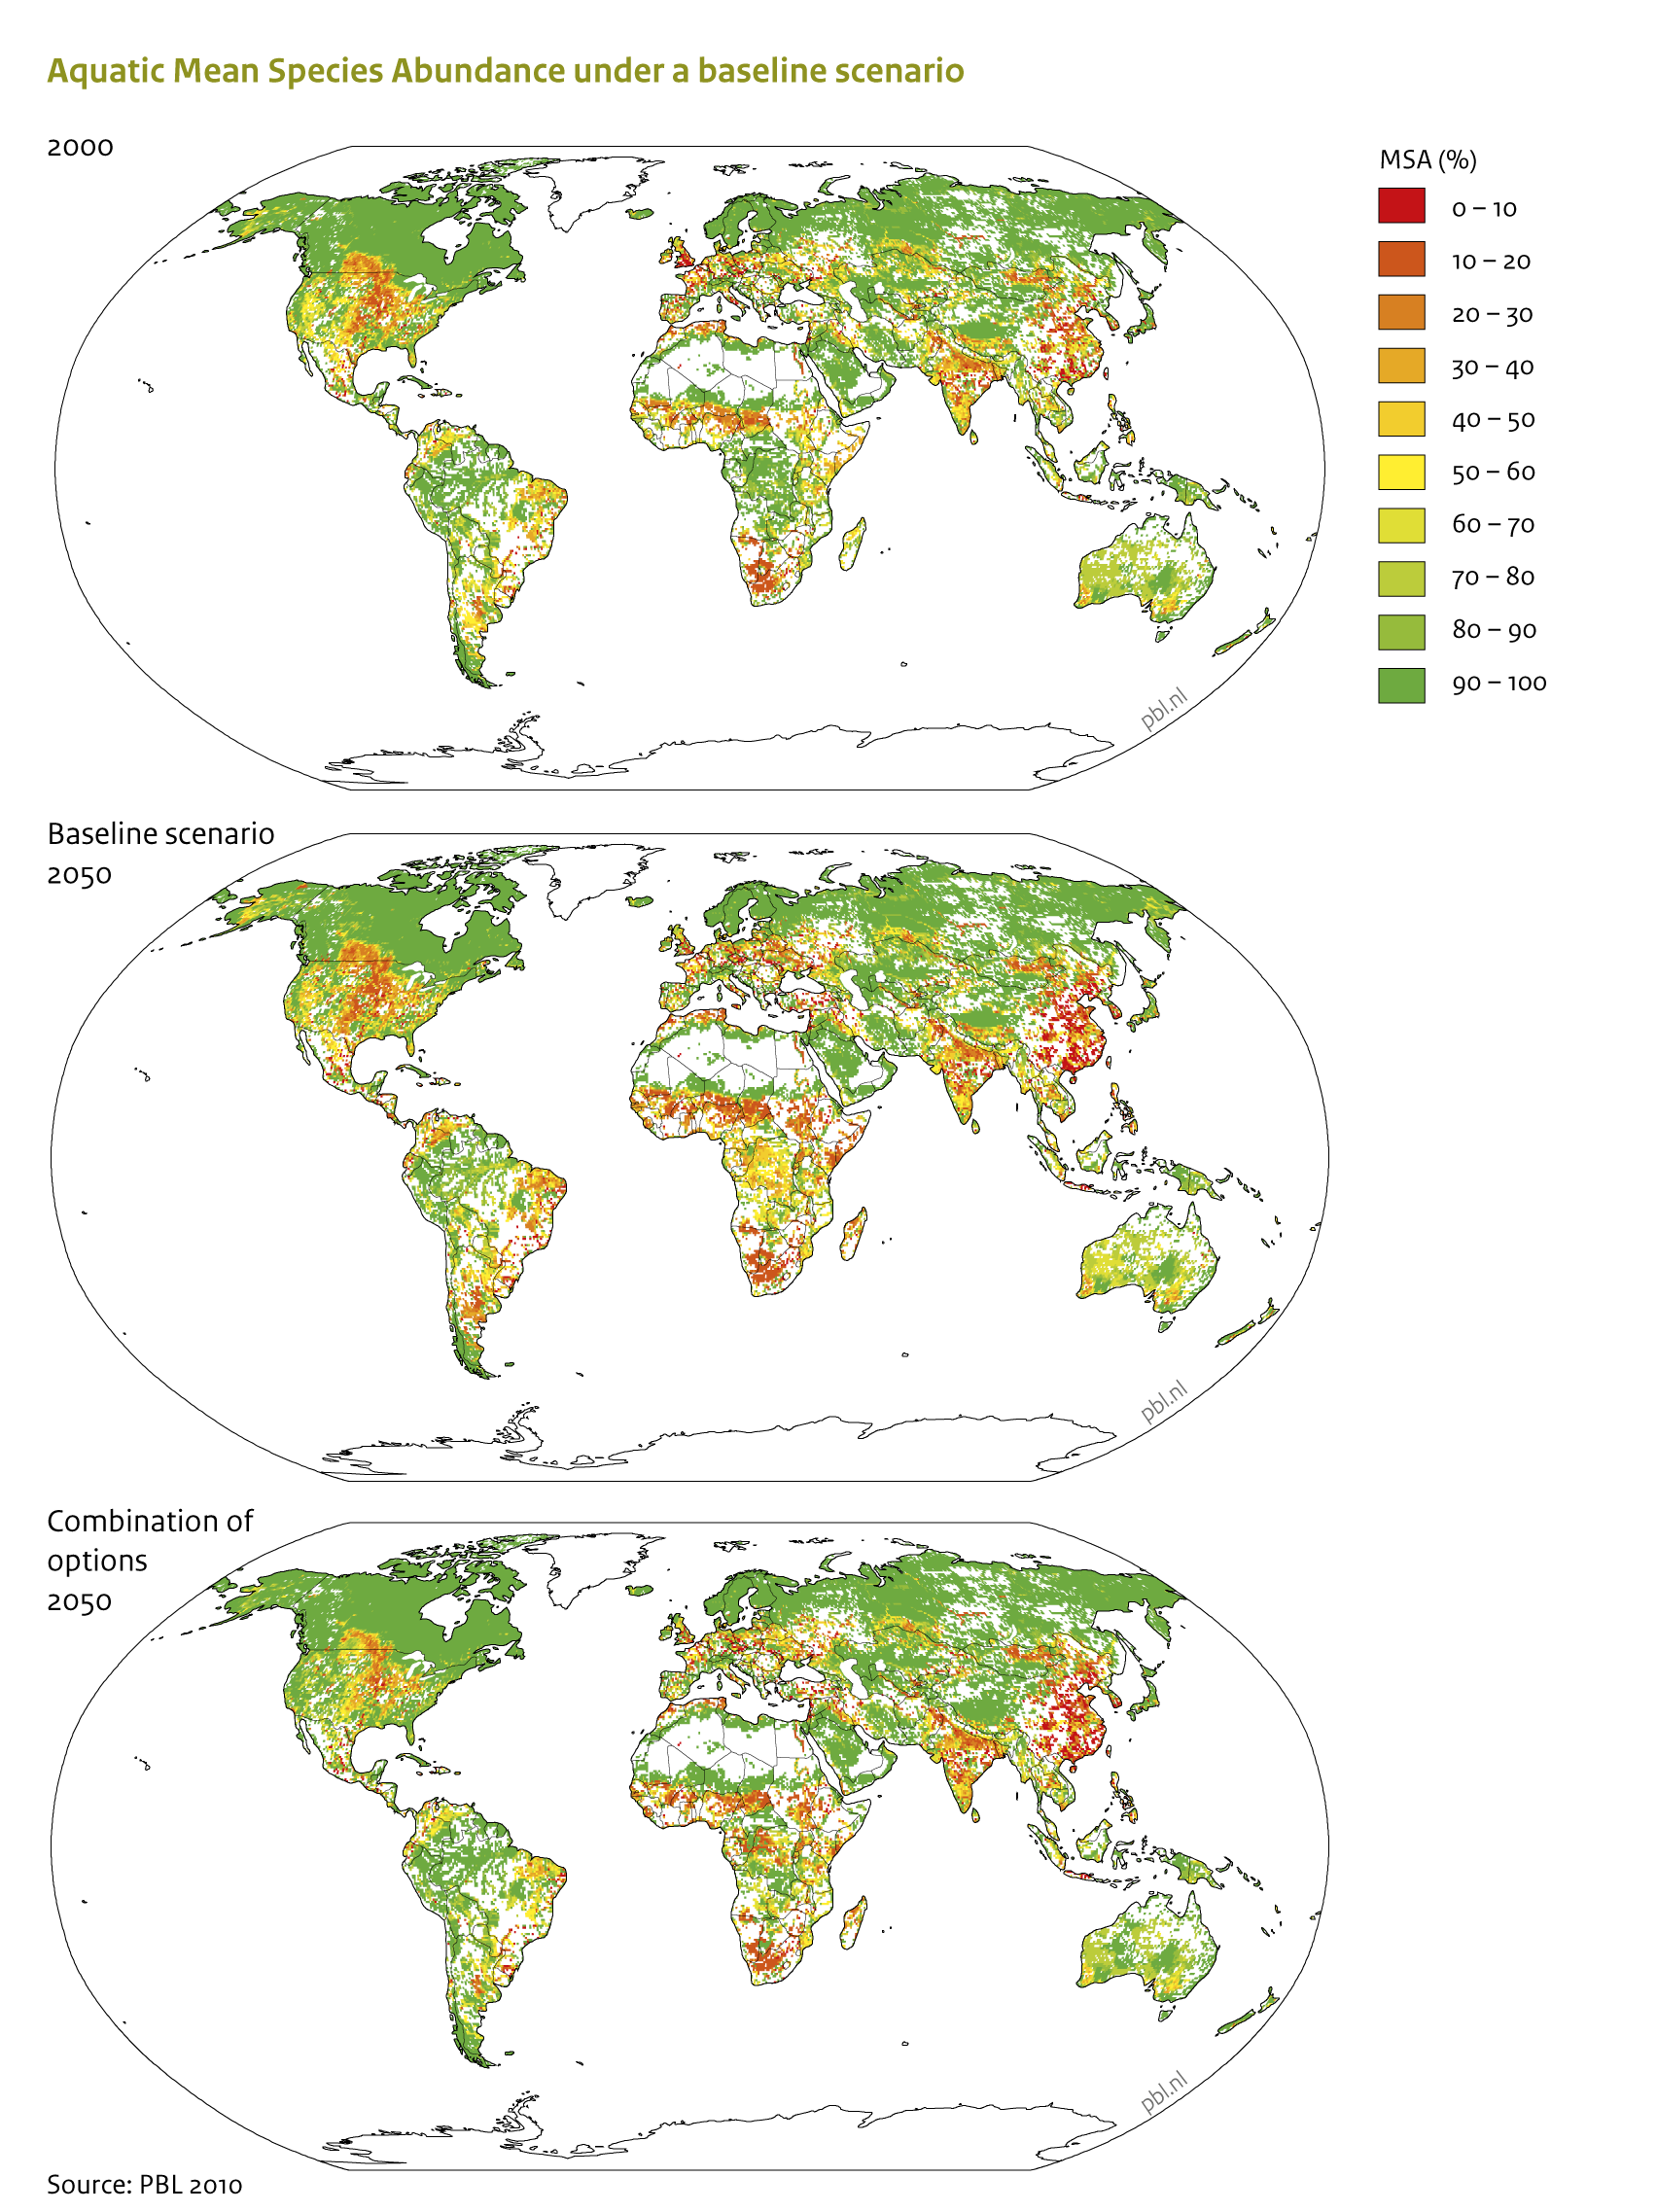
|AltText= | |AltText=Aquatic Mean Species Abundance under a baseline scenario | ||
|Caption= | |Caption=In a baseline scenario, aquatic biodiversity is projected to decrease further. | ||
|FigureType=Baseline figure | |FigureType=Baseline figure | ||
|OptimalSize=600 | |OptimalSize=600 | ||
|Component=Aquatic biodiversity; | |Component=Aquatic biodiversity; | ||
}} | }} | ||
Revision as of 14:43, 23 May 2014
Caption: In a baseline scenario, aquatic biodiversity is projected to decrease further.
Figure is used on page(s): Aquatic biodiversity