Baseline figure Human development: Difference between revisions
Jump to navigation
Jump to search
No edit summary |
(CSV import) |
||
| Line 1: | Line 1: | ||
{{FigureTemplate | {{FigureTemplate | ||
|Figure=118x img13.png | |Figure=118x img13.png | ||
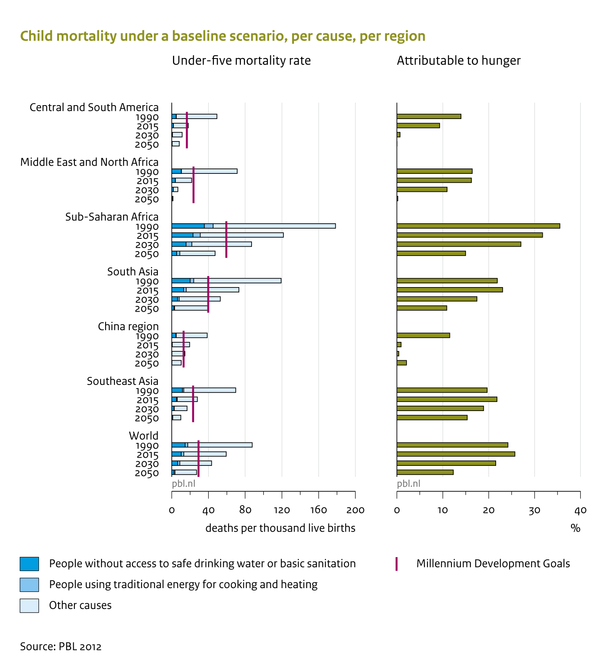
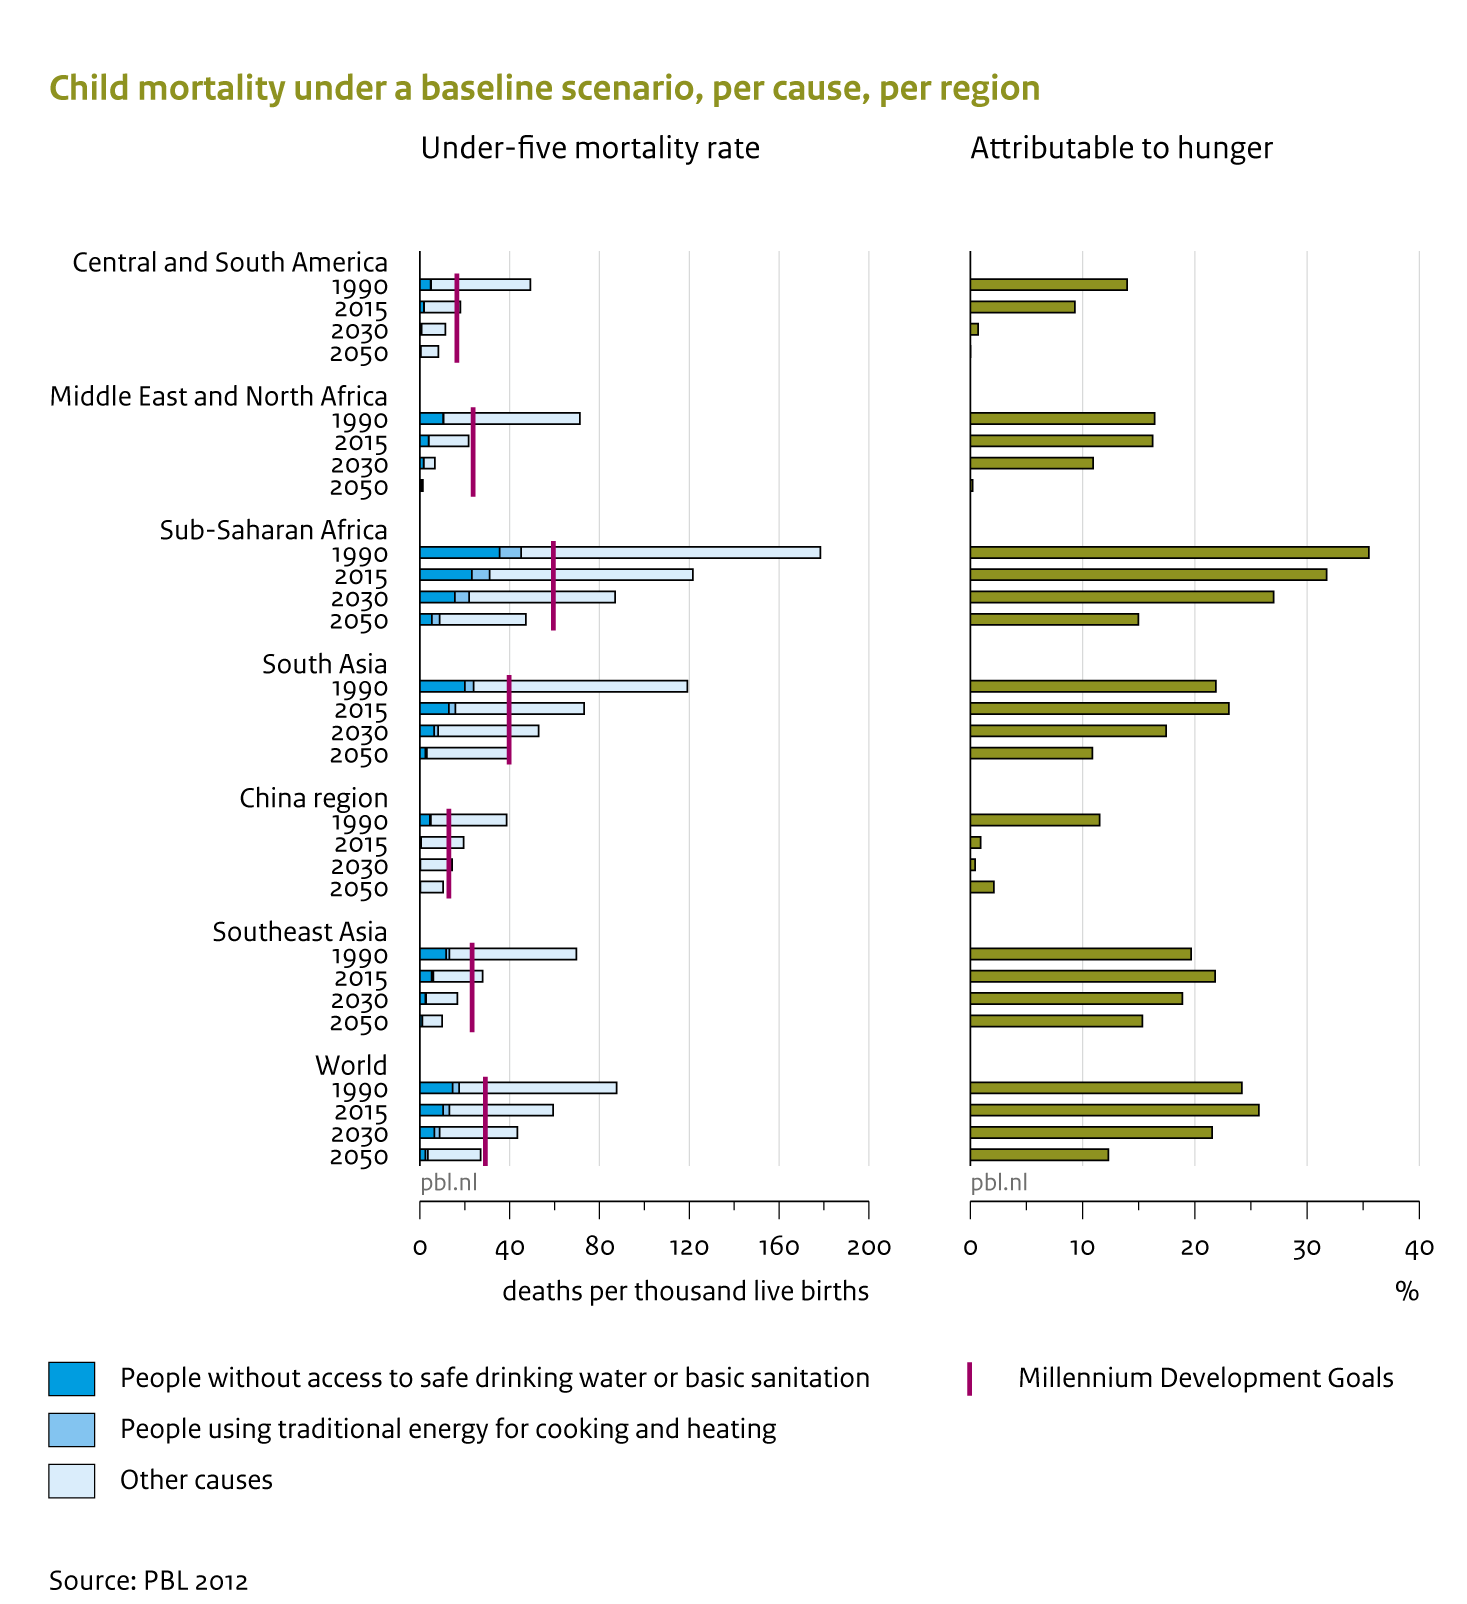
|AltText=Child mortality | |AltText=Child mortality under a baseline scenario, per cause, per region | ||
|Caption= | |Caption=Under a baseline scenario, the global under-five mortality rates will only reach the level of the Millenium Development goals by 2050. | ||
|FigureType=Baseline figure | |FigureType=Baseline figure | ||
|OptimalSize=600 | |OptimalSize=600 | ||
|Component=Human development; | |Component=Human development; | ||
}} | }} | ||
Revision as of 14:43, 23 May 2014
Caption: Under a baseline scenario, the global under-five mortality rates will only reach the level of the Millenium Development goals by 2050.
Figure is used on page(s): Human development