File:Sector value added digraph inputvariable dot.png
Jump to navigation
Jump to search
No higher resolution available.
Sector_value_added_digraph_inputvariable_dot.png (399 × 176 pixels, file size: 9 KB, MIME type: image/png)
ImageMap
When including this image in a wiki page, use the following mark-up to enable links:
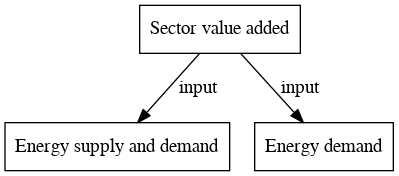
<imagemap>
File:Sector_value_added_digraph_inputvariable_dot.png
rect 95 5 255 53 [[Sector value added]]
rect 5 123 141 171 [[Energy demand]]
rect 167 123 388 171 [[Energy supply and demand]]</imagemap>
See ImageMap for more information.
File history
Click on a date/time to view the file as it appeared at that time.
| Date/Time | Thumbnail | Dimensions | User | Comment | |
|---|---|---|---|---|---|
| current | 15:35, 20 March 2020 | | 399 × 176 (9 KB) | Graphviz (talk | contribs) | |
| 14:53, 20 March 2020 | 171 × 59 (2 KB) | Graphviz (talk | contribs) | |||
| 16:53, 19 March 2020 |  | 235 × 176 (6 KB) | Oostenrijr (talk | contribs) | ||
| 16:53, 19 March 2020 | 171 × 59 (2 KB) | Oostenrijr (talk | contribs) | |||
| 15:18, 12 March 2020 |  | 399 × 176 (9 KB) | Oostenrijr (talk | contribs) | ||
| 15:18, 12 March 2020 |  | 219 × 179 (6 KB) | Oostenrijr (talk | contribs) | ||
| 15:17, 12 March 2020 |  | 219 × 179 (6 KB) | Oostenrijr (talk | contribs) | ||
| 09:34, 19 November 2018 |  | 393 × 176 (8 KB) | Oostenrijr (talk | contribs) | generated by the GraphViz extension from the Sector value added page |
You cannot overwrite this file.
File usage
There are no pages that use this file.