Flood risks/Description: Difference between revisions
Jump to navigation
Jump to search
No edit summary |
No edit summary |
||
| Line 1: | Line 1: | ||
{{ComponentDescriptionTemplate | {{ComponentDescriptionTemplate | ||
|Status=On hold | |Status=On hold | ||
|Reference= | |Reference=Loveland et al., 2000; Van Beek et al., 2011; Wada et al., 2011; Hinkel and Klein, 2009; | ||
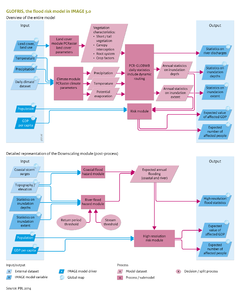
|Description=The purpose of the [[GLOFRIS model]] ([[Winsemius et al., 2012]]; [[Ward et al., 2013]]) is to estimate the effect of land cover and climate change on flood risks in river catchments and coastal areas on a global level. The global flood risks are expressed in the projected number of people affected, annually, and in GDP value. GLOFRIS uses land-cover input from [[IMAGE land use model|IMAGE]] and climate time series, such as the IPCC GCM projections. These input data drive a global hydrological model ([[PCR-GLOBWB model|PCR-GLOBWB]], the computational core of the module). PCR-GLOBWB calculates where and when flooding events may occur, and calculates the inundation extent and depth needed to estimate flood risks. PCR-GLOBWB has features (daily time steps and proper accounting of the relationship between non-linear soil moisture and run-off) that make this model appropriate for simulating flooding events. The spatial resolution currently used by the model is 0.5 x 0.5 degrees (and 5 x 5 minute resolution, currently under development). The different model steps of the main GLOFRIS module are shown in the model flow diagram of GLOFRIS on the right. | |Description=The purpose of the [[GLOFRIS model]] ([[Winsemius et al., 2012]]; [[Ward et al., 2013]]) is to estimate the effect of land cover and climate change on flood risks in river catchments and coastal areas on a global level. The global flood risks are expressed in the projected number of people affected, annually, and in GDP value. GLOFRIS uses land-cover input from [[IMAGE land use model|IMAGE]] and climate time series, such as the IPCC GCM projections. These input data drive a global hydrological model ([[PCR-GLOBWB model|PCR-GLOBWB]], the computational core of the module). PCR-GLOBWB calculates where and when flooding events may occur, and calculates the inundation extent and depth needed to estimate flood risks. PCR-GLOBWB has features (daily time steps and proper accounting of the relationship between non-linear soil moisture and run-off) that make this model appropriate for simulating flooding events. The spatial resolution currently used by the model is 0.5 x 0.5 degrees (and 5 x 5 minute resolution, currently under development). The different model steps of the main GLOFRIS module are shown in the model flow diagram of GLOFRIS on the right. | ||
The land-cover map ‘Global Land Cover Characterization’ ([[HasAcronym::GLCC]]) ([[Loveland et al., 2000]]) is the basis of the parameters of the PCR-GLOBWB hydrological model (model flow diagram of GLOFRIS on the right). These parameters express the hydrological characteristics of different land-cover types. IMAGE and PCR-GLOBWB are linked by lookup tables that translate the IMAGE land-cover classification into that of GLCC. | The land-cover map ‘Global Land Cover Characterization’ ([[HasAcronym::GLCC]]) ([[Loveland et al., 2000]]) is the basis of the parameters of the PCR-GLOBWB hydrological model (model flow diagram of GLOFRIS on the right). These parameters express the hydrological characteristics of different land-cover types. IMAGE and PCR-GLOBWB are linked by lookup tables that translate the IMAGE land-cover classification into that of GLCC. | ||
Revision as of 11:37, 17 December 2013
Parts of Flood risks/Description
| Component is implemented in: |
|
| Related IMAGE components |
| Models/Databases |
| Key publications |
| References |