Flowchart Flood risks: Difference between revisions
Jump to navigation
Jump to search

Oostenrijr (talk | contribs) No edit summary |
Oostenrijr (talk | contribs) m (Reverted edits by Oostenrijr (talk) to last revision by RinekeOostenrijk) |
||
| Line 1: | Line 1: | ||
{{FigureTemplate | {{FigureTemplate | ||
|Figure= | |Figure=105x img13.png | ||
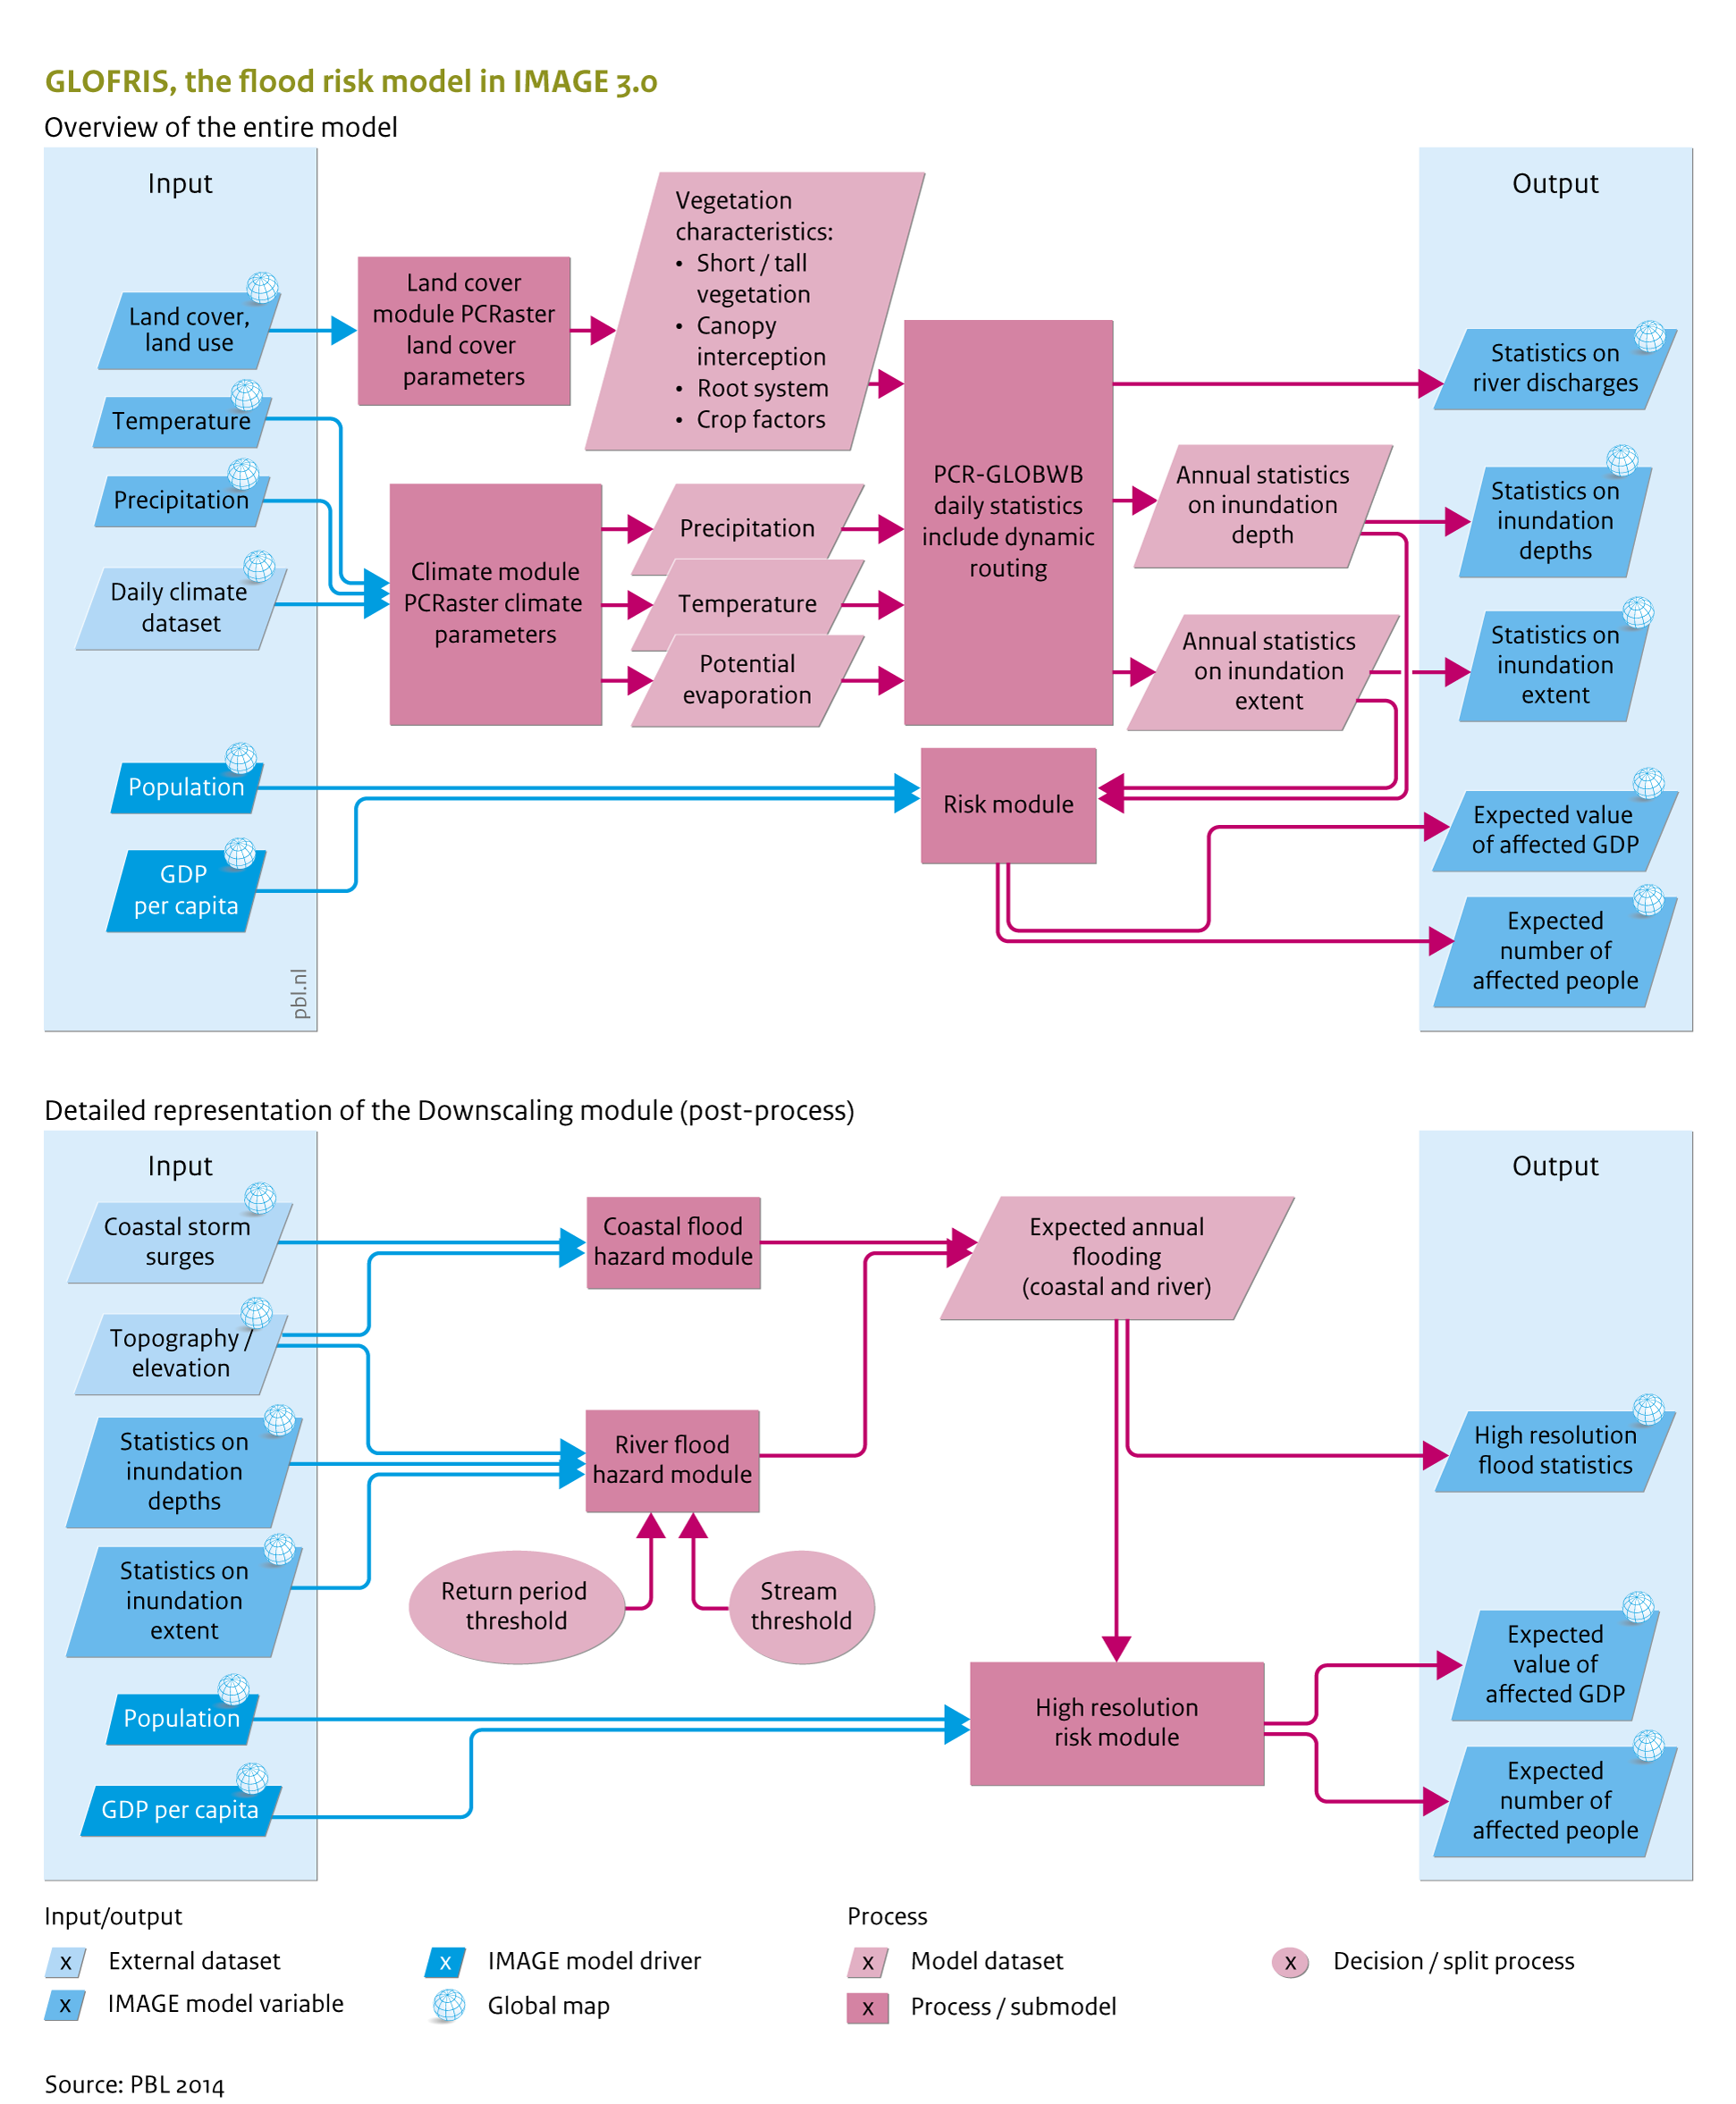
|AltText=GLOFRIS, the flood risk model in IMAGE 3.0 | |AltText=GLOFRIS, the flood risk model in IMAGE 3.0 | ||
|Caption=More detail on inputs and outputs, and how they link to other IMAGE components is presented at Input/Output Table. | |Caption=More detail on inputs and outputs, and how they link to other IMAGE components is presented at Input/Output Table. | ||
Revision as of 15:23, 16 June 2014
Caption: More detail on inputs and outputs, and how they link to other IMAGE components is presented at Input/Output Table.
Figure is used on page(s): Flood risks