Flowchart Human development: Difference between revisions
Jump to navigation
Jump to search

m (Text replace - "FigurePage" to "Figure") |
No edit summary |
||
| Line 4: | Line 4: | ||
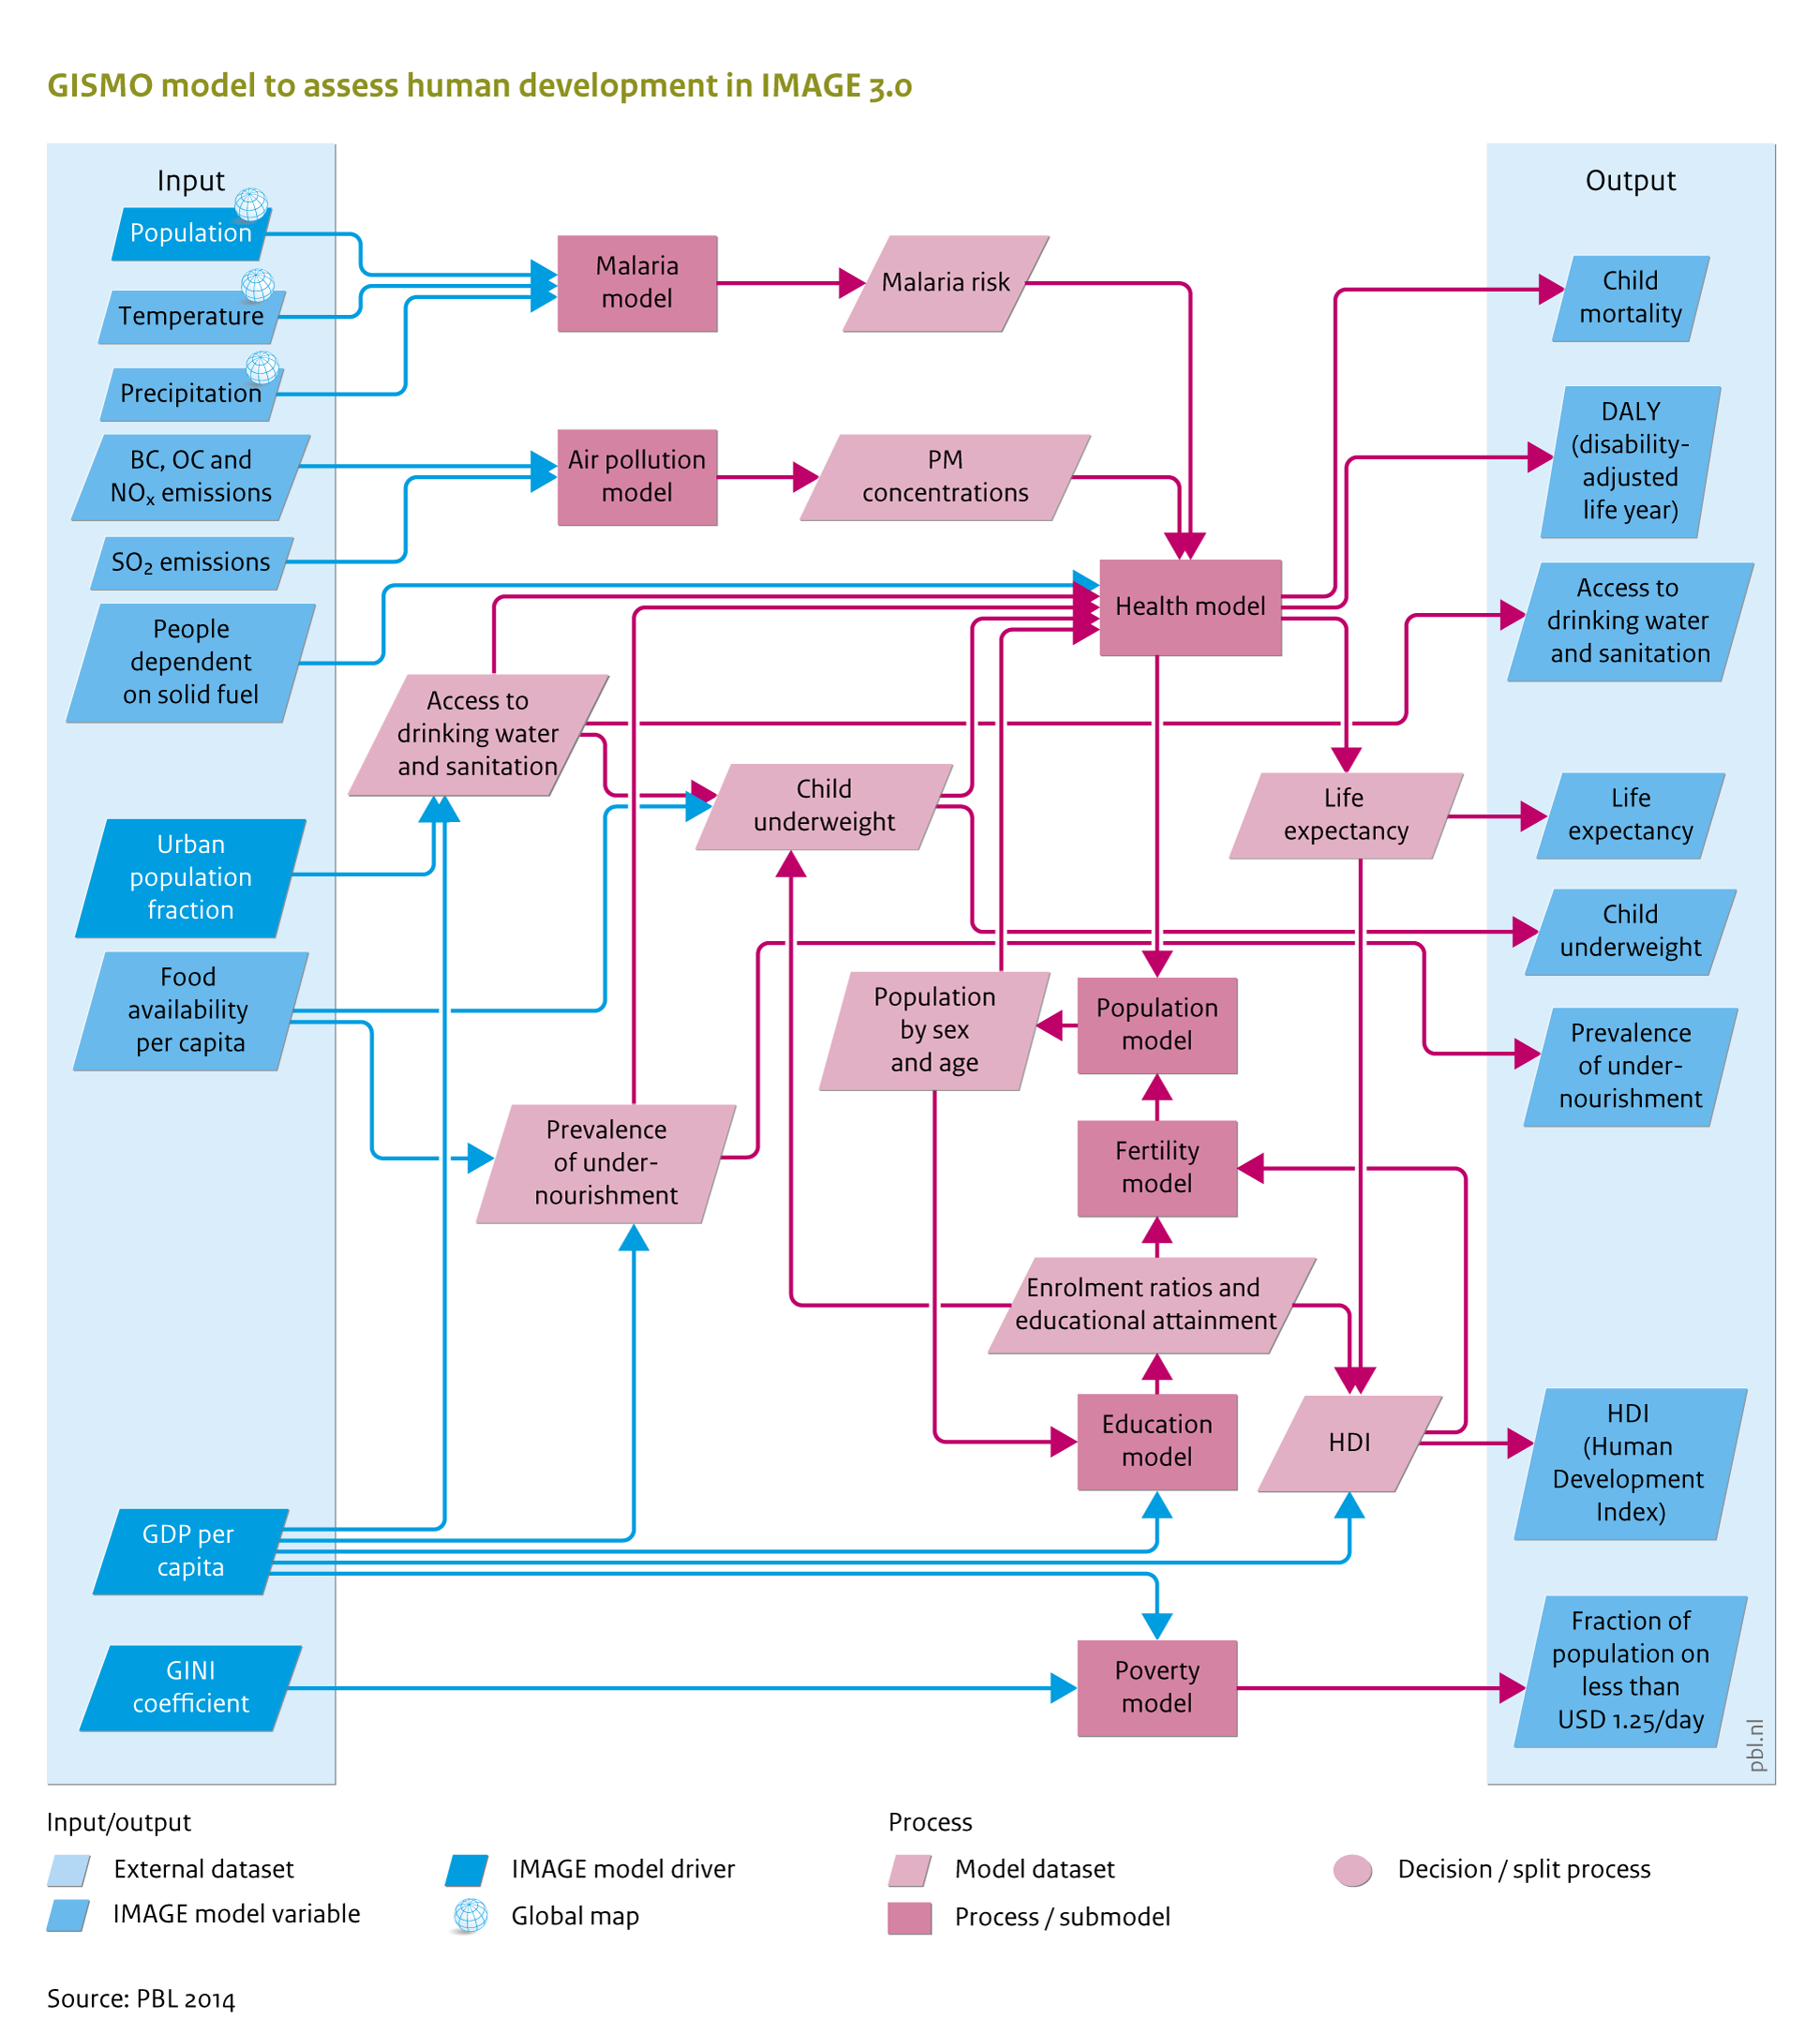
|Caption=GISMO model overview and linkages. Green boxes represent the main modules of the GISMO models, red rectangles represent indicators that are included in the Millennium Development Goals. | |Caption=GISMO model overview and linkages. Green boxes represent the main modules of the GISMO models, red rectangles represent indicators that are included in the Millennium Development Goals. | ||
|FigureType=Flowchart | |FigureType=Flowchart | ||
|OptimalSize=800 | |||
|Component=Human development; | |Component=Human development; | ||
}} | }} | ||
Revision as of 15:36, 27 January 2014
Caption: GISMO model overview and linkages. Green boxes represent the main modules of the GISMO models, red rectangles represent indicators that are included in the Millennium Development Goals.
Figure is used on page(s): Human development