Flowchart Land degradation: Difference between revisions
Jump to navigation
Jump to search
Oostenrijr (talk | contribs) No edit summary |
Oostenrijr (talk | contribs) No edit summary |
||
| Line 4: | Line 4: | ||
|Caption={{PAGENAME}}. See also the Input/Output Table on the introduction page. | |Caption={{PAGENAME}}. See also the Input/Output Table on the introduction page. | ||
|FigureType=Flowchart | |FigureType=Flowchart | ||
|OptimalSize= | |OptimalSize=600 | ||
|Component=Land degradation; | |Component=Land degradation; | ||
}} | }} | ||
Latest revision as of 19:02, 15 November 2018
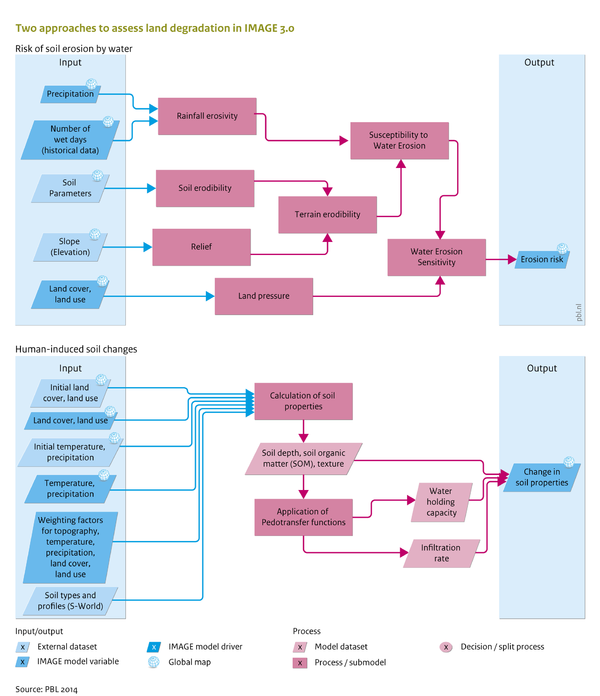
Caption: Flowchart Land degradation. See also the Input/Output Table on the introduction page.
Figure is used on page(s): Land degradation