Policy intervention figure Carbon cycle and natural vegetation II: Difference between revisions
Jump to navigation
Jump to search
No edit summary |
(CSV import) |
||
| Line 1: | Line 1: | ||
{{FigureTemplate | {{FigureTemplate | ||
|Figure= | |Figure=076g img13.png | ||
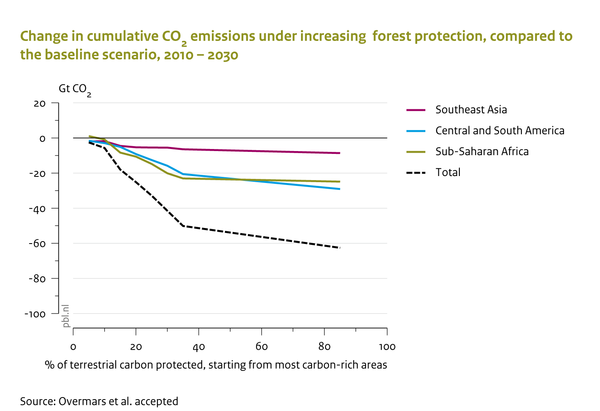
|Caption= | |Caption=Increasingly strict REDD regimes might lead to substantial reduction in cumulative terrestrial CO2 emission (Overmars et al., accepted). | ||
|FigureType=Policy intervention figure | |FigureType=Policy intervention figure | ||
|OptimalSize=600 | |OptimalSize=600 | ||
|Component=Carbon cycle and natural vegetation; | |Component=Carbon cycle and natural vegetation; | ||
|AltText=Change in cumulative CO2 emissions under increasing forest protection, compared to the baseline scenario, 2010-2030 | |||
}} | }} | ||
Revision as of 14:43, 23 May 2014
Caption: Increasingly strict REDD regimes might lead to substantial reduction in cumulative terrestrial CO2 emission (Overmars et al., accepted).
Figure is used on page(s): Carbon cycle and natural vegetation