Policy intervention figure Water: Difference between revisions
Jump to navigation
Jump to search
No edit summary |
m (Text replace - "Hydrological cycle" to "Water") |
||
| Line 5: | Line 5: | ||
|FigureType=Policy intervention figure | |FigureType=Policy intervention figure | ||
|OptimalSize=600 | |OptimalSize=600 | ||
|Component= | |Component=Water; | ||
}} | }} | ||
Revision as of 14:46, 8 May 2014
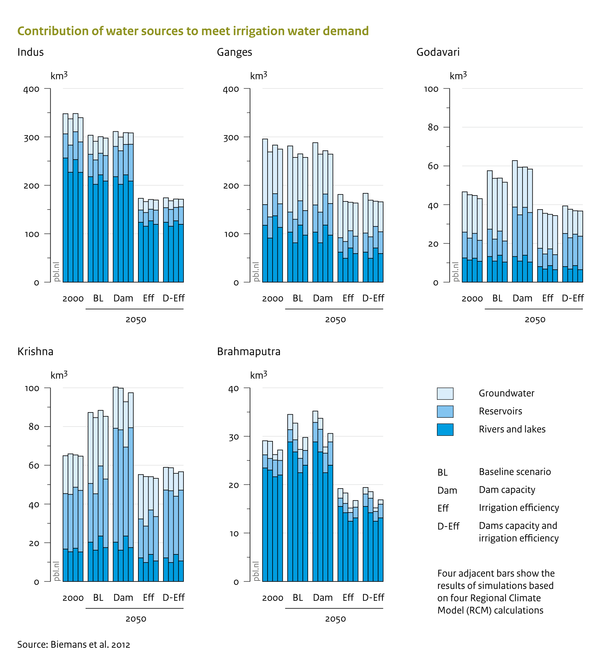
Caption: Contribution of water sources to fulfil irrigation water demand. Bars represent mean annual irrigation withdrawal demand in km3 and its sources of supply for five study basins on the Indian subcontinent. Results are shown for present (i.e. 1971–2000) climate and year-2000 land use (A), and for the future (i.e. 2036–2065 climate and 2050 land-use projection) under a baseline scenario without policy interventions (B), a doubling of the capacity of large reservoirs (C), improved irrigation efficiency (D), and a combination of the last two (E). Four combined bars show the results from simulations forced by four Regional Climate Model (RCM) results. Note the different scales for different basins.
Figure is used on page(s): Water