Ecosystem services/Policy issues: Difference between revisions
Jump to navigation
Jump to search
m (Text replace - "|Status=On hold" to "") |
No edit summary |
||
| Line 1: | Line 1: | ||
{{ComponentPolicyIssueTemplate | {{ComponentPolicyIssueTemplate | ||
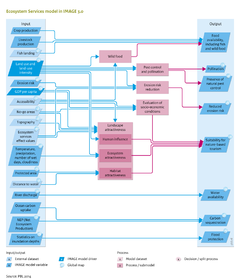
|Description=Figure 7.5.3 shows the fraction of people resp. agricultural land receiving sufficient ES, A decreasing trend for most ES budgets is expected, except for food. According to the scenario sufficient food will be produced at regional level, An unequal distribution of food will still lead to malnutrition or hunger. The ESs “pest control”, “pollination” and “erosion protection” is not delivered sufficiently everywhere and the area is likely to decrease. Availability of water per person and the amount of carbon sequestrated relative to the amount emitted also decreases. | |||
|Example=Figure 7.5.3 illustrate, as an example, the effect of one of the RIO+20 scenarios (global technology scenario, “GT”) on the sufficient delivery of ES. Figure 7.5.3 illustrates that the “GT” scenario positively influence the delivery of most ES. The percentage of sufficient delivery of most ES are increased compared to both the baseline in 2000 and in 2050. The “GT” scenario strongly focusses on limiting climate change, which is also illustrated in the sufficient delivery of the ES “carbon sequestration”. The sharp decline of the ES “water” in the baseline 2050 is prevented in the “GT” scenario, due to meeting the millennium development goals. However there is little change in the sufficient delivery of , “pollination” and “pest control”. | |||
}} | }} | ||
Revision as of 13:35, 26 March 2014
Parts of Ecosystem services/Policy issues
| Component is implemented in: |
|
| Related IMAGE components |
| Projects/Applications |
| Key publications |