Ecosystem services
Parts of Ecosystem services
| Component is implemented in: |
|
| Related IMAGE components |
| Projects/Applications |
| Key publications |
| References |
Key policy issues
- How would ecosystem services and the benefits from the natural environment develop in the absence of specific policies?
- How could policy interventions contribute to improving future ecosystem services?
- How could policy interventions influence the interaction between ecosystem services and other goals and ambitions, such as the millennium development goals?
Introduction
Ecosystem services contribute to human well-being often in combination with other inputs (Burkhard et al., 2012). The identification and classification of the wide range of ecosystem services is still debated, but consensus is moving to the list of services published in the Millennium Ecosystem Assessment (MA), and further elaborated in the TEEB study and the CICES project (MA, 2005; TEEB, 2010b; De Groot et al., 2012; Haines-Young and Potschin, 2013):
- Provisioning services: goods and products obtained directly from the ecosystem, such as food, water and wood;
- Regulating services: benefits associated with physical processes influenced by the ecosystem, such as climate regulation and erosion control;
- Cultural services: non-material benefits to humans such as recreation;
- Supporting services: Processes assisting the supply of other ecosystem services, such as soil nutrient cycling supporting the provisioning of agricultural production though often not identified as a separate category.
Since the Millennium Ecosystem Assessment, the concept of ecosystems services has drawn increasing attention with many studies determining the influence on human well-being (Van Jaarsveld et al., 2005; TEEB, 2010b; TEEB, 2010a; Burkhard et al., 2012). For example, the TEEB study focused on the economic implications of the losses of a variety of ecosystem services , and other studies have tried to unravel the less tangible benefits of ecosystems to illustrate the importance of ecosystem conservation (Egoh et al., 2012; Bagstad et al., 2013; Garcia-Nieto et al., 2013).
Understanding of ecosystem services is needed because pressures on ecosystems tend to increase as the world population grows and consumption patterns change. Unsustainable use and degradation of ecosystems may diminish delivery of services and may eventually impact human well-being (MA, 2005; TEEB, 2010a; OECD, 2012). While food production, an ecosystem service itself, is increasing, it also puts pressure on other services, for instance by forest conversion to agricultural land may result in decreasing supply of clean water, ecotourism, and flood and drought control (MA, 2005; Foley et al., 2011).
Growing concern about the unsustainable use has led to ecosystem services being incorporated in international and national policies. For example, the CBD Aichi targets endorsed by the EU biodiversity strategy address ecosystem services and the sustainable use of ecosystems (EC, 2012).
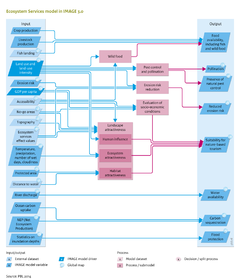
Ecosystem services are closely linked to the core focus of the IMAGE 3.0 framework to analyse interactions between human and natural systems (see IMAGE framework). The ecosystems services module quantifies the supply of services, defined as functioning of ecosystems to produce services in a given time period. To quantify ecosystem services, a range of indicators is used from other IMAGE components , together with additional relationships developed to establish supply of services (Schulp et al., 2012). To identify deficiencies and surpluses in ecosystem services, the calculated supply is compared with the potential requirement for these services at an appropriate spatial scale.
Input/Output Table
Input Ecosystem services component
| IMAGE model drivers and variables | Description | Source |
|---|---|---|
| Protected area - grid | Map of protected nature areas, limiting use of this area. | Drivers |
| GDP per capita - grid | Scaled down GDP per capita from country to grid level, based on population density. | Drivers |
| Number of wet days - grid (historical data) | Number of days with a rain event, per month; assumed constant after the historical period | CRU database |
| Cloudiness - grid (historical data) | Percentage of cloudiness per month; assumed constant after the historical period | CRU database |
| Temperature - grid | Monthly average temperature. | Atmospheric composition and climate |
| Precipitation - grid | Monthly total precipitation. | Atmospheric composition and climate |
| Ocean carbon uptake | Ocean carbon uptake. | Atmospheric composition and climate |
| NEP (net ecosystem production) - grid | Net natural exchange of CO2 between biosphere and atmosphere (NPP minus soil respiration), excluding human induced fluxes such as decay of wood products. | Carbon cycle and natural vegetation |
| Livestock production | Production of livestock products (dairy, beef, sheep and goats, pigs, poultry). | Agricultural economy |
| Erosion risk - grid | Risk of soil erosion caused by water. | Land degradation |
| Crop production | Regional production per crop. | Agricultural economy |
| Statistics on inundation depth - grid | Annual statistics of water depth in flooded areas of a grid cell. | Flood risks |
| River discharge - grid | Average flow of water through each grid cell. | Water |
| Land use and land-use intensity - grid | High resolution land use and land use intensity based on GLC2000 and IMAGE land cover and land use. | Terrestrial biodiversity |
| External datasets | Description | Source |
|---|---|---|
| Accessibility - grid | Accessibility expressed as travel time. | |
| Distance to water - grid | Distance to water. | based on HYDRO1K database, GTOPO30 DEM, coastline map and USGS 2009 |
| Ecosystem services effect values | Database on relationships between environmental factors and ecosystem services. | |
| Fish landing - grid | Fish landings according to statistics from "Sea around us". | |
| No-go areas - grid | Indicator to account for the fact that tourists do not visit countries in war, with high poverty rates or poor safety conditions. This index includes hunger, refugees, war, corruption, homocides and theft | The World Bank, World development indicators and global development finance |
| Topography - grid | Topography and altitude, determining the altitude range within a grid cell. | GLOBE Digital Elevation Model |
Output Ecosystem services component
| IMAGE model variables | Description | Use |
|---|---|---|
| Food availability, including fish and wild food | Food availability, including fish and wild food. | Final output |
| Flood protection - grid | Reduction in flood risk by natural vegetation. | Final output |
| Pollination - grid | Additional yield due to natural pollination. | Final output |
| Suitability for nature-based tourism - grid | Attractiveness for nature-based tourism. | Final output |
| Carbon sequestration - grid | Net carbon uptake by terrestrial ecosystems and oceans. | Final output |
| Presence of natural pest control - grid | Presence of natural pest control. | Final output |
| Water availability - grid | Water availability in rivers, lakes and reservoirs. | Final output |
| Reduced erosion risk - grid | Reduction in erosion risk by natural vegetation. | Final output |