Baseline figure Agricultural economy: Difference between revisions
Jump to navigation
Jump to search
No edit summary |
Dafnomilii (talk | contribs) No edit summary |
||
| (11 intermediate revisions by 4 users not shown) | |||
| Line 1: | Line 1: | ||
{{ | {{FigureTemplate | ||
|Figure= | |Figure=Ercab7abaf2 hr.jpg | ||
| | |AltText=Global agricultural production and areas per region | ||
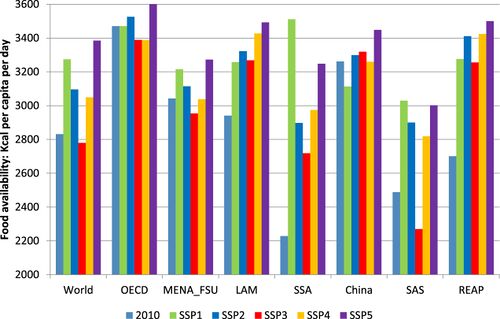
|Component=Agricultural economy | |Caption=Food availability measured in kcal per capita per day available for consumption, for initial situation (2010) and for the SSP scenarios (2100), globally and by region. (van Meijl et al., 2020b) | ||
|FigureType=Baseline figure | |||
|OptimalSize=500 | |||
|Component=Agricultural economy | |||
}} | }} | ||
Latest revision as of 15:31, 31 October 2021
Caption: Food availability measured in kcal per capita per day available for consumption, for initial situation (2010) and for the SSP scenarios (2100), globally and by region. (van Meijl et al., 2020b)
Figure is used on page(s): Agricultural economy