Baseline figure Ecosystem services: Difference between revisions
Jump to navigation
Jump to search

(Created page with "{{FigurePageTemplate |Figure=115k_img13.png |Caption=Ecosystems supply and demand map of the world. |Component=Ecosystem goods and services; }}") |
Oostenrijr (talk | contribs) m (Oostenrijr moved page Baseline figure EGS to Baseline figure Ecosystem services without leaving a redirect: Text replace - "EGS" to "Ecosystem services") |
||
| (5 intermediate revisions by 2 users not shown) | |||
| Line 1: | Line 1: | ||
{{ | {{FigureTemplate | ||
|Figure= | |Figure=115k img13.png | ||
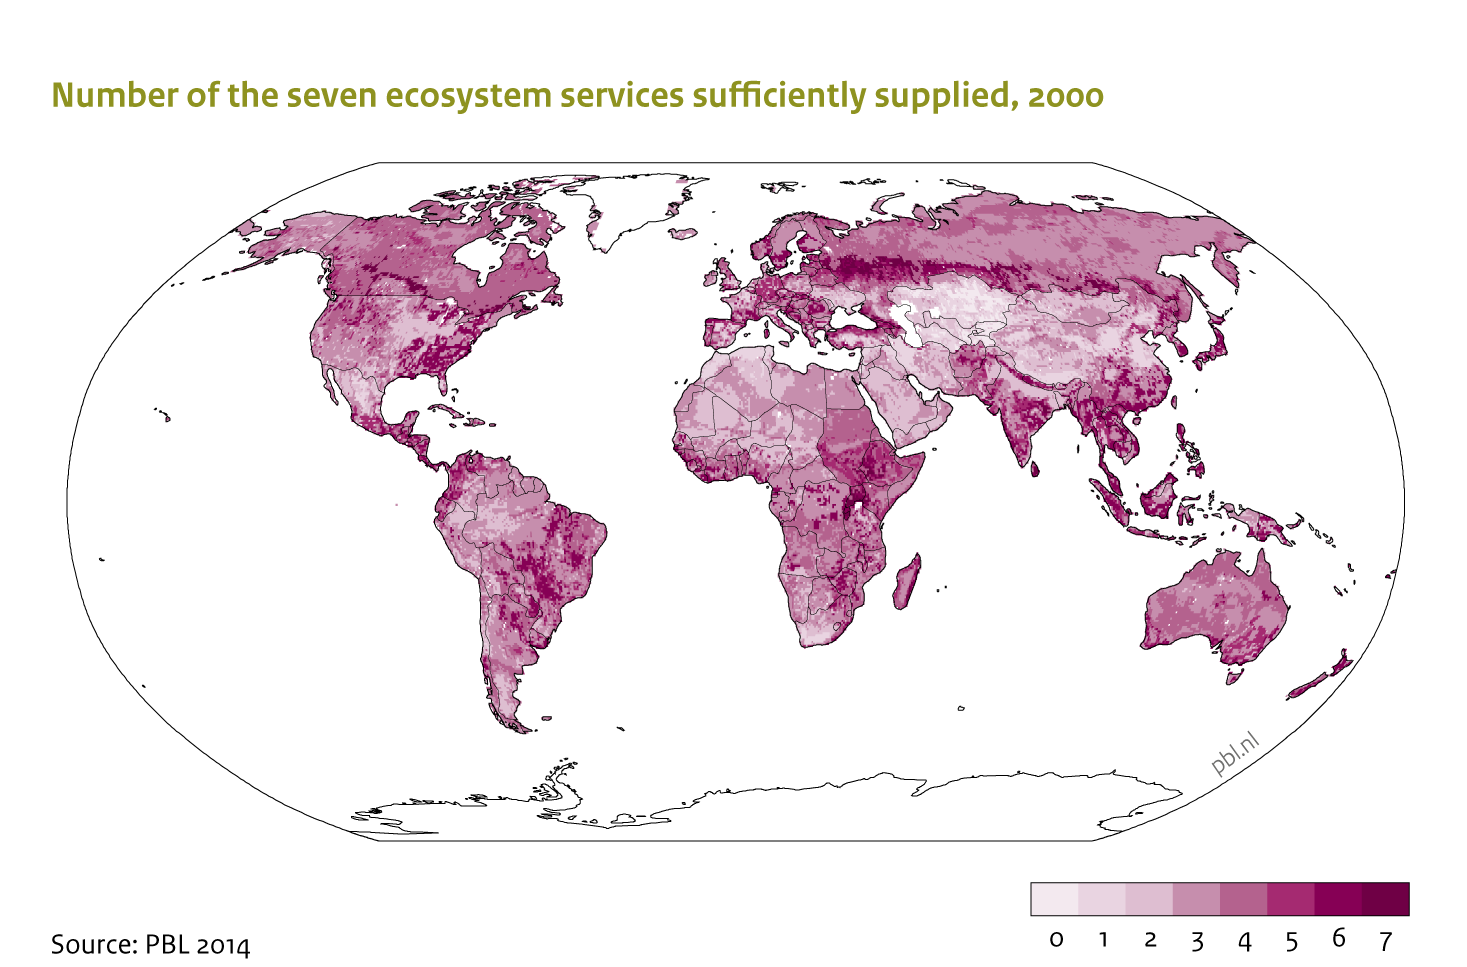
|Caption= | |Caption=Assessing how many of the 7 ecosystem services addressed in IMAGE (food, water, Carbon sequestration, erosion protection, pollination, pest control, flood protection, tourism) can be sufficiently supplied allows to identify hotspots of losses in ecosystem services. | ||
|Component=Ecosystem | |FigureType=Baseline figure | ||
|OptimalSize=600 | |||
|Component=Ecosystem services; | |||
|AltText=Numder of the seven ecosystem services sufficiently suppled, 2000 | |||
}} | }} | ||
Latest revision as of 15:08, 24 June 2014
Caption: Assessing how many of the 7 ecosystem services addressed in IMAGE (food, water, Carbon sequestration, erosion protection, pollination, pest control, flood protection, tourism) can be sufficiently supplied allows to identify hotspots of losses in ecosystem services.
Figure is used on page(s): Ecosystem services