Policy intervention figure Ecosystem services: Difference between revisions
Jump to navigation
Jump to search
(Created page with "{{FigurePageTemplate |Figure=116g_img13.png |Caption=Assessment of sufficient supply of Ecosystem Services in the baseline as a map for the year 2000 (top), and aggregated to ...") |
Oostenrijr (talk | contribs) m (Oostenrijr moved page Policy intervention figure EGS to Policy intervention figure Ecosystem services without leaving a redirect: Text replace - "EGS" to "Ecosystem services") |
||
| (7 intermediate revisions by 2 users not shown) | |||
| Line 1: | Line 1: | ||
{{ | {{FigureTemplate | ||
|Figure= | |Figure=116g img13.png | ||
|Caption= | |Caption=While the supply of ecosystem services is decreasing under a baseline scenario, much of this decline could be avoided under a sustainability scenario (all based on PBL, 2012). | ||
|Component=Ecosystem | |FigureType=Policy intervention figure | ||
|OptimalSize=600 | |||
|Component=Ecosystem services; | |||
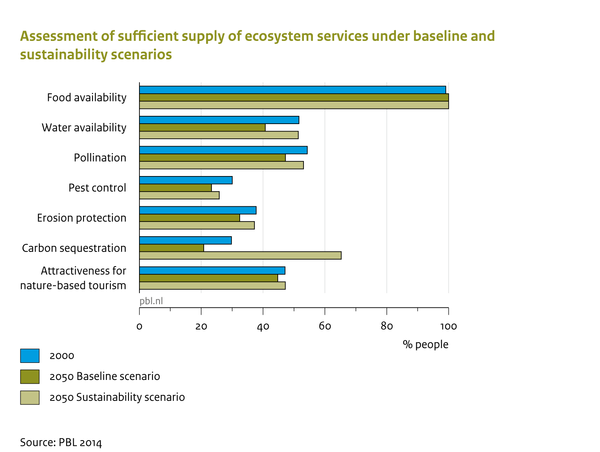
|AltText=Assessment of sufficient supply of ecosystem services under the baseline and sustainability scenarios | |||
}} | }} | ||
Latest revision as of 15:08, 24 June 2014
Caption: While the supply of ecosystem services is decreasing under a baseline scenario, much of this decline could be avoided under a sustainability scenario (all based on PBL, 2012).
Figure is used on page(s): Ecosystem services