Baseline figure Land-use allocation: Difference between revisions
Jump to navigation
Jump to search

(Created page with "{{FigurePageTemplate |Figure=059X_img13.png |Caption=Distribution of Land use in the year 2005 (top) and in 2050 (below), adopted from van Asselen et al. 2012. |FigureType=B...") |
Dafnomilii (talk | contribs) No edit summary |
||
| (11 intermediate revisions by 4 users not shown) | |||
| Line 1: | Line 1: | ||
{{ | {{FigureTemplate | ||
|Figure= | |Figure=Capture.PNG | ||
| | |AltText=Distribution of land systems | ||
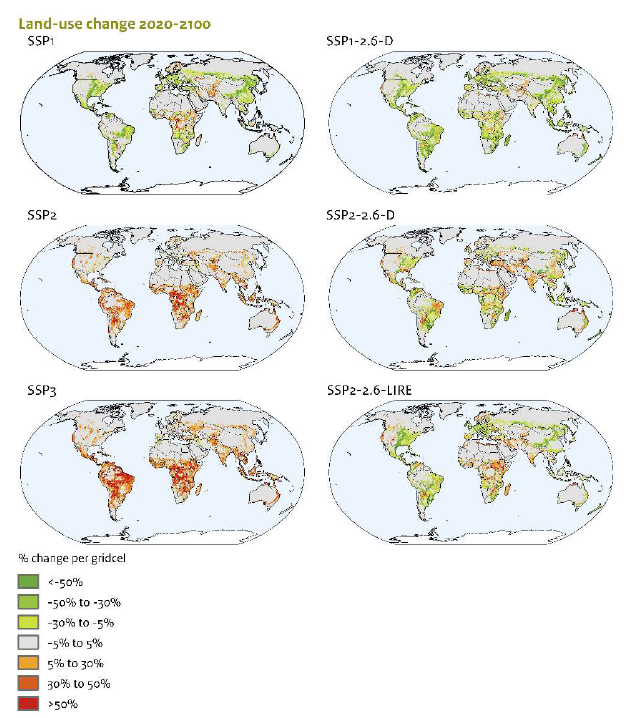
|Caption=Natural land conversion in selected SSP scenarios for the 2020-2100 period (van Vuuren et al., 2021) | |||
|FigureType=Baseline figure | |FigureType=Baseline figure | ||
|Component=Land use allocation | |OptimalSize=600 | ||
|Component=Land-use allocation | |||
}} | }} | ||
Latest revision as of 16:38, 31 October 2021
Caption: Natural land conversion in selected SSP scenarios for the 2020-2100 period (van Vuuren et al., 2021)
Figure is used on page(s): IMAGE framework summary/Interaction, Land-use allocation, Model description IMAGE-CLUMondo