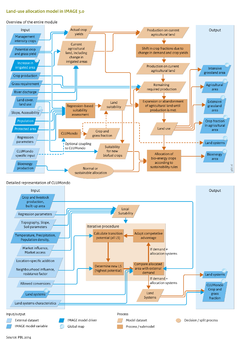
Land-use allocation
Parts of Land-use allocation
| Component is implemented in: |
| Components: |
| Related IMAGE components |
| Projects/Applications |
| Key publications |
| References |
Key policy issues
- How will changes in agricultural demand and trade affect future land-use patterns?
- How will land-use regulation, such as protected areas and REDD schemes, affect future land use and the impacts of land-use change?
- How can agricultural intensification increase global food production, and what policies will contribute to this?
Introduction
About one third of the Earth’s land area is under cropland and pasture. The proportion of areas suitable for agriculture that is already in use is even larger. Humans strongly depend on agricultural production, as supported by soils and climatic circumstances, and thus need to rely on a continued functioning of these systems. On the other hand, major environmental problems arise from the size and intensity of agricultural land use, for example greenhouse gas emissions, distortions of the nutrient and water cycles, and biodiversity loss. Total agricultural area, globally or in a region, may be sufficient to assess the first order effects of production potential and environmental impacts. However, the location of agricultural land in a region or landscape is extremely important because yields of crops and grass depend on soil and climate, and also on spatially heterogeneous socio-economic factors, and because many impacts are location dependent.
The location of new agricultural area determines the vegetation type removed, and thus the amount of carbon emitted, and the biodiversity impacts related to a loss of the vegetation type. Extreme examples of location-specific impacts are conversion of carbon- and species-rich peatland and wetlands. Other factors include the impact of agriculture on nutrient and water cycles, and location characteristics such as soil properties and slope. As well as the location, the composition of landscapes is a determining factor because how land uses are connected determines to some extent the environmental impact and the production potential. For environmental impacts, the most prominent examples of landscape composition are biodiversity effects, wind and water erosion, hydrology, and ecosystem services. Some crops benefit from nearby forests for pollination and pest control, while others suffer additional pest pressure. Consequently, accurate and high resolution modelling of agricultural land use is essential in global integrated assessment.
In IMAGE, the spatial allocation of crops, pasture and bioenergy is driven by regional crop and grassland production and their respective intensity levels, as calculated by the the IMAGE agro-economic model (Agricultural economy), by the potential crop and grass yields (Crops and grass), and spatial allocation suitability factors.
Input/Output Table
Input Land-use allocation component
| IMAGE model drivers and variables | Description | Source |
|---|---|---|
| Increase in irrigated area - grid | Increase in irrigated area, often based on external projections (e.g., FAO). | Drivers |
| Protected area - grid | Map of protected nature areas, limiting use of this area. | Drivers |
| Population - grid | Number of people per gridcell (using downscaling). | Drivers |
| Bioenergy production | Total bioenergy production. | Energy supply, Energy supply and demand |
| Grass requirement | Grass requirement; ruminants (nondairy cattle, dairy cattle, sheep and goats) are grazing animals, and part (in mixed systems) or most (pastoral systems) of their feed is grass, hay or other roughage; this grass requirement is calculated as a fraction of the total energy (feed) requirement. | Livestock systems |
| Potential crop and grass yield - grid | Potential crop and grass yield, changing over time due to climate change and possibly soil degradation. In some components, i.e. 'Agricultural economy' regional aggregations of the dataset which depend on the actual land-use area, are used. | Crops and grass |
| River discharge - grid | Average flow of water through each grid cell. | Water |
| Management intensity crops | Management intensity crops, expressing actual yield level compared to potential yield. While potential yield is calculated for each grid cell, this parameter is expressed at the regional level. This parameter is based on data and exogenous assumptions - current practice and technological change in agriculture - and is endogenously adapted in the agro-economic model. | Agricultural economy |
| Crop production | Regional production per crop. | Agricultural economy |
| Land cover, land use - grid | Multi-dimensional map describing all aspects of land cover and land use per grid cell, such as type of natural vegetation, crop and grass fraction, crop management, fertiliser and manure input, livestock density. | Land cover and land use |
| External datasets | Description | Source |
|---|---|---|
| Agricultural land use suitability - grid | Suitability of land in a grid cell for agriculture and forestry, as a function of accessibility, population density, slope and potential crop yields. |
Output Land-use allocation component
| IMAGE model variables | Description | Use |
|---|---|---|
| Crop fraction in agricultural area - grid | Fraction of agricultural land by crop type, per grid cell. | |
| Bioenergy area | Area of bioenergy crop production, in model setting where sustainability criteria require that the area for bioenergy crops is not included in the agricultural production area (to avoid competition between bioenergy and food). | |
| Extensive grassland area - grid | Extensive pasture with low productivity used for grazing. | |
| Agricultural area - grid | Total area for crop production (annual and perennial) and intensive grassland. | |
| Intensive grassland area | Intensively used grassland areas for grazing or mowing, at locations also suitable for crop production. |
