Baseline figure Energy supply: Difference between revisions
Jump to navigation
Jump to search
No edit summary |
Oostenrijr (talk | contribs) m (Oostenrijr moved page Baseline figure ES to Baseline figure Energy supply without leaving a redirect: Text replace - "ES" to "Energy supply") |
||
| (5 intermediate revisions by 2 users not shown) | |||
| Line 1: | Line 1: | ||
{{ | {{FigureTemplate | ||
|Figure=036x img13.png | |Figure=036x img13.png | ||
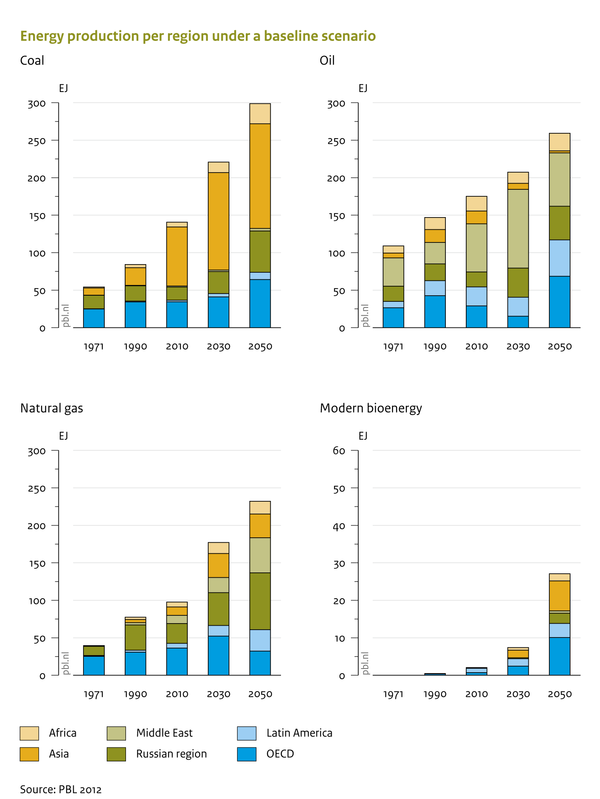
|Caption= | |AltText=Energy production per region under a baseline scenario | ||
|Caption=Over time the share of most important energy producers for different forms of energy changes. This has implications for energy security. | |||
|FigureType=Baseline figure | |FigureType=Baseline figure | ||
|OptimalSize=600 | |||
|Component=Energy supply; | |Component=Energy supply; | ||
}} | }} | ||
Latest revision as of 16:13, 24 June 2014
Caption: Over time the share of most important energy producers for different forms of energy changes. This has implications for energy security.
Figure is used on page(s): Energy supply