Policy intervention figure Air pollution and energy policies: Difference between revisions
Jump to navigation
Jump to search
m (Text replace - "FigurePage" to "Figure") |
Oostenrijr (talk | contribs) No edit summary |
||
| (6 intermediate revisions by 3 users not shown) | |||
| Line 1: | Line 1: | ||
{{FigureTemplate | {{FigureTemplate | ||
|Figure=132g img13.png | |Figure=132g img13.png | ||
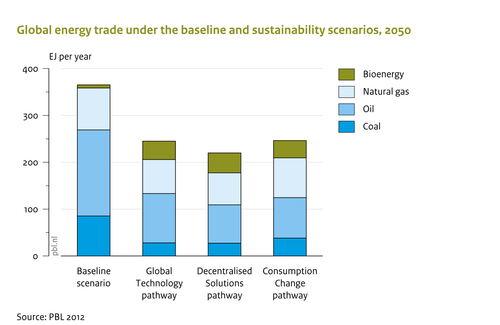
|AltText=Global energy trade | |AltText=Global energy trade under the baseline and sustainability scenarios, 2050 | ||
|Caption= | |Caption=Compared to the baseline, energy trade is significantly reduced under the sustainability scenarios (PBL, 2012). | ||
|FigureType=Policy intervention figure | |FigureType=Policy intervention figure | ||
|Component= | |OptimalSize=500 | ||
|Component=Air pollution and energy policies | |||
}} | }} | ||
Latest revision as of 10:26, 20 March 2020
Caption: Compared to the baseline, energy trade is significantly reduced under the sustainability scenarios (PBL, 2012).
Figure is used on page(s): Air pollution and energy policies, Air pollution and energy policies/Policy issues